
|
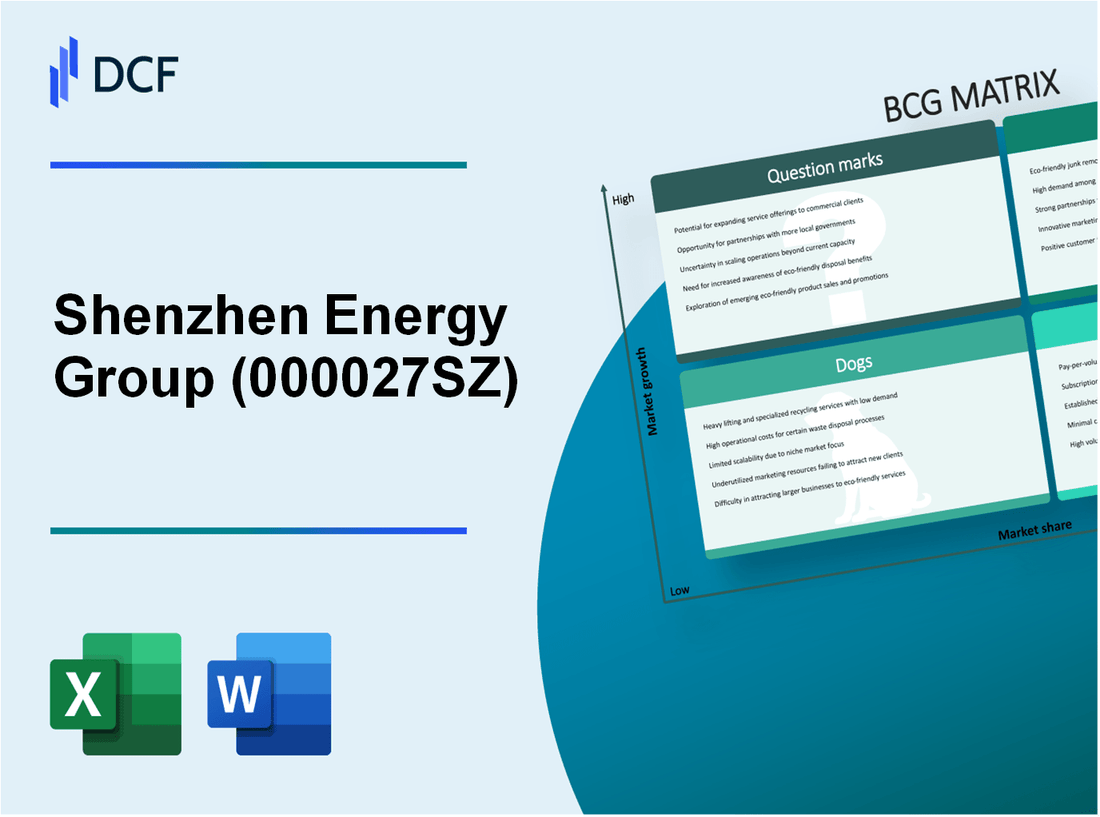
Shenzhen Energy Group Co., Ltd. (000027.SZ): BCG Matrix |
Fully Editable: Tailor To Your Needs In Excel Or Sheets
Professional Design: Trusted, Industry-Standard Templates
Investor-Approved Valuation Models
MAC/PC Compatible, Fully Unlocked
No Expertise Is Needed; Easy To Follow
Shenzhen Energy Group Co., Ltd. (000027.SZ) Bundle
Shenzhen Energy Group Co., Ltd. stands at the forefront of the energy transition, balancing a diverse portfolio that spans stars in renewable initiatives to dogs in outdated operations. In this blog post, we dive into the dynamics of the BCG Matrix, exploring how this major player in the energy sector navigates its strengths, weaknesses, and opportunities in a rapidly changing market. Discover what makes their solar and wind projects shine and which areas need urgent attention below.
Background of Shenzhen Energy Group Co., Ltd.
Shenzhen Energy Group Co., Ltd. is a prominent Chinese enterprise primarily engaged in the energy sector. Established in 1998, the company has rapidly developed into a leading player in both traditional and renewable energy markets, focusing on electricity generation, thermal power, and clean energy solutions.
As of 2022, Shenzhen Energy operates a diverse range of energy projects, including coal-fired, gas-fired, and wind power facilities. The company's total installed capacity exceeds 17,000 MW, positioning it among the top energy providers in China.
Shenzhen Energy’s strategic emphasis on innovation and sustainability is evident in its commitment to reducing carbon emissions. The company has invested significantly in renewable energy developments, including solar and wind projects, in alignment with China's ambitious goals for carbon neutrality by 2060.
The company is also publicly traded on the Shenzhen Stock Exchange under the ticker symbol 000027. Its stock performance has attracted considerable attention from investors, particularly as the demand for clean energy solutions continues to surge globally.
Financially, Shenzhen Energy has exhibited robust growth. In 2021, the company reported a revenue of approximately CNY 61 billion (about USD 9.4 billion), with a net profit margin of around 7.6%. The company aims to enhance its operational efficiency while expanding its renewable energy portfolio.
Through various partnerships and government initiatives, Shenzhen Energy is forging ahead with projects that not only address the energy demands of the region but also contribute to a more sustainable energy landscape.
Shenzhen Energy Group Co., Ltd. - BCG Matrix: Stars
Shenzhen Energy Group Co., Ltd. has strategically positioned itself within the renewable energy sector, particularly focusing on high-growth initiatives. This positioning has enabled the company to classify its primary business units as Stars in the BCG Matrix.
Renewable Energy Projects
Shenzhen Energy is heavily invested in various renewable energy projects. In 2022, the company's total installed capacity reached approximately 12,550 MW, with over 8,500 MW from renewable sources, which demonstrates a strong market presence. The revenue generated from these projects has shown consistent growth, with an increase of 15% year-over-year, amounting to about RMB 27 billion in 2022.
Solar Power Initiatives
The solar power initiatives have been a significant driver of Shenzhen Energy's growth. As of the end of 2022, the company had commissioned solar projects totaling approximately 3,000 MW, making it one of the largest solar power producers in China. The segment reported revenues of nearly RMB 10 billion for 2022, up from RMB 8.6 billion in 2021. The growth rate for this segment indicates a robust market share of around 20% within the region.
| Year | Total Installed Solar Capacity (MW) | Revenue from Solar Power (RMB) | Market Share (%) |
|---|---|---|---|
| 2021 | 2,500 | 8.6 billion | 18% |
| 2022 | 3,000 | 10 billion | 20% |
Wind Energy Expansion
The wind energy sector is another critical area where Shenzhen Energy has established itself as a leader. The company expanded its wind energy capacity to about 5,000 MW by the end of 2022. This expansion included several new projects in coastal regions, contributing an additional revenue of approximately RMB 12 billion in 2022, marking a growth of 12% compared to the previous year.
| Year | Total Installed Wind Capacity (MW) | Revenue from Wind Energy (RMB) |
|---|---|---|
| 2021 | 4,500 | 10.7 billion |
| 2022 | 5,000 | 12 billion |
The sustained investments in both solar and wind energy have not only solidified Shenzhen Energy's position as a market leader but also enhanced its potential for future growth. By maintaining high market share in these rapidly expanding sectors, Shenzhen Energy is well-positioned for long-term success in the renewable energy market.
Shenzhen Energy Group Co., Ltd. - BCG Matrix: Cash Cows
Shenzhen Energy Group Co., Ltd. operates in the energy sector, where certain segments of its business have been categorized as Cash Cows. These segments yield high profit margins and substantial cash flow, primarily due to their established market presence and competitive advantages in a mature market.
Thermal Power Generation
Shenzhen Energy's thermal power generation segment stands out due to its significant capacity and reliability. In 2022, the company reported an installed thermal power generation capacity of approximately 10,500 MW, which positions it as one of the leading contributors to the regional energy supply.
The thermal power segment contributed roughly RMB 22 billion in revenue, accounting for over 55% of the company’s total annual revenue. The profit margin in this sector remains robust at around 30%, underscoring the efficiencies achieved through economies of scale and established operational protocols.
Long-term Energy Supply Contracts
Shenzhen Energy has secured numerous long-term energy supply contracts, which guarantee steady revenue streams. As of 2023, these contracts cover approximately 75% of the company’s power output, providing predictability amidst market fluctuations. The average contract duration is about 15 years, ensuring sustained cash flow.
With these contracts, the company generates about RMB 18 billion annually, translating to a stable operating income contribution of approximately RMB 5.4 billion after accounting for operational costs. The low capital expenditure requirement on these contracts makes them a prime example of Cash Cows.
Established Regional Electricity Distribution
Shenzhen Energy’s established regional electricity distribution network enhances its market position. The company distributes electricity across multiple provinces, with a network covering over 2000 km and serving approximately 4 million customers.
In the fiscal year 2022, the distribution segment yielded revenues of around RMB 15 billion with an operating margin of approximately 25%. This segment's low growth rate of 3% annually reflects a mature market; however, it continues to generate substantial cash flows that support the company’s overall financial health.
| Business Segment | Installed Capacity (MW) | Revenue (RMB billion) | Profit Margin (%) | Customers Served (million) |
|---|---|---|---|---|
| Thermal Power Generation | 10,500 | 22 | 30 | N/A |
| Long-term Energy Contracts | N/A | 18 | 30 | N/A |
| Regional Electricity Distribution | N/A | 15 | 25 | 4 |
These Cash Cow segments significantly contribute to Shenzhen Energy's ability to fund growth initiatives in other areas of the business, such as the development of new technologies and expansion into renewable energy sources. By leveraging the stable cash flows generated from these segments, Shenzhen Energy Group can maintain its competitive edge while ensuring long-term sustainability.
Shenzhen Energy Group Co., Ltd. - BCG Matrix: Dogs
Shenzhen Energy Group Co., Ltd. operates several business units categorized as Dogs, reflecting their low market share and low growth potential.
Outdated Coal Plants
Shenzhen Energy has several coal-fired power plants that are approaching the end of their operational lifespans. The average operating age of these plants is approximately 30 years. In 2022, the revenue generated from these outdated facilities was around ¥3.2 billion, with an EBITDA margin of merely 8%. The company has incurred increasing maintenance costs, averaging ¥800 million annually, which significantly reduces profitability.
Non-Core Business Ventures
Several non-core business ventures are considered Dogs within Shenzhen Energy's portfolio. The company invested approximately ¥1 billion in renewable energy projects that have not met growth expectations. These projects contribute less than 5% to total revenue, generating around ¥150 million in annual income. The estimated operational costs amount to ¥200 million annually, indicating a loss in this segment.
High-Cost Legacy Operations
Shenzhen Energy's legacy operations include various thermal power plants that rely on outdated technology. These operations collectively account for 15% of total capacity but are responsible for over 25% of total operational costs. In 2022, the total revenue from these high-cost operations stood at ¥5 billion, while the total expenses climbed to ¥4.5 billion, yielding a minimal profit margin of only 10%.
| Segment | Revenue (¥ billion) | EBITDA Margin (%) | Maintenance Costs (¥ million) | Annual Income (¥ million) | Operational Costs (¥ million) |
|---|---|---|---|---|---|
| Outdated Coal Plants | 3.2 | 8 | 800 | N/A | N/A |
| Non-Core Business Ventures | 0.15 | N/A | N/A | 150 | 200 |
| High-Cost Legacy Operations | 5.0 | 10 | N/A | N/A | 4,500 |
The overall performance of these Dogs highlights the financial strain and risk associated with maintaining operations in low-growth, low-market-share segments. The substantial investments and commitments in these units pose challenges for Shenzhen Energy, emphasizing the need for strategic divestiture or restructuring to free up capital for more profitable ventures.
Shenzhen Energy Group Co., Ltd. - BCG Matrix: Question Marks
Shenzhen Energy Group Co., Ltd. operates in several emerging sectors, where certain business units fall under the 'Question Marks' category in the BCG Matrix. These sectors show high growth potential, yet the company currently holds a low market share. Key areas of focus include emerging battery storage technology, electric vehicle charging infrastructure, and overseas energy market exploration.
Emerging Battery Storage Technology
The global battery storage market is projected to grow significantly, estimated at approximately $20 billion in 2022 and expected to reach $50 billion by 2027, reflecting a compound annual growth rate (CAGR) of around 20%. Shenzhen Energy has initiated several projects in this sector, with an investment of ¥1 billion (approximately $145 million) dedicated to research and development in 2023. However, the company’s current market share in battery storage stands at only 5%.
Electric Vehicle Charging Infrastructure
As electric vehicle (EV) adoption surges, the demand for EV charging infrastructure is booming. The global market is valued at around $30 billion in 2022 and is expected to grow at a CAGR of approximately 25% to reach $100 billion by 2026. Shenzhen Energy has installed approximately 500 EV charging stations, representing a modest share of the growing market. Despite these installations, the company’s market penetration is at only 4%.
| Year | Global EV Charging Market Value | Projected Growth Rate | Shenzhen Energy Charging Stations | Market Share (%) |
|---|---|---|---|---|
| 2022 | $30 billion | 25% | 500 | 4% |
| 2026 | $100 billion | - | - | - |
Overseas Energy Market Exploration
Shenzhen Energy has begun to explore overseas markets, particularly in Southeast Asia and Africa, where energy demand is surging. In 2022, the company allocated a budget of ¥800 million (approximately $115 million) for international expansion, including partnerships and joint ventures. Despite the initial investment, the overseas market share is under 3%, indicating significant room for growth.
| Market | Investment (¥) | Investment ($) | Market Share (%) |
|---|---|---|---|
| Southeast Asia | ¥400 million | $58 million | 3% |
| Africa | ¥400 million | $58 million | 2% |
These question mark categories within Shenzhen Energy's business model require strategic decision-making. The investments made in these areas can potentially transform them into 'Stars' if market share increases significantly. However, they currently consume substantial capital with limited immediate returns.
Shenzhen Energy Group Co., Ltd. exemplifies the dynamic landscape of the energy sector through its strategic positioning within the BCG Matrix, balancing high-potential renewable projects alongside established cash cows, while also addressing legacy challenges and exploring groundbreaking technologies in the energy transition.
[right_small]Disclaimer
All information, articles, and product details provided on this website are for general informational and educational purposes only. We do not claim any ownership over, nor do we intend to infringe upon, any trademarks, copyrights, logos, brand names, or other intellectual property mentioned or depicted on this site. Such intellectual property remains the property of its respective owners, and any references here are made solely for identification or informational purposes, without implying any affiliation, endorsement, or partnership.
We make no representations or warranties, express or implied, regarding the accuracy, completeness, or suitability of any content or products presented. Nothing on this website should be construed as legal, tax, investment, financial, medical, or other professional advice. In addition, no part of this site—including articles or product references—constitutes a solicitation, recommendation, endorsement, advertisement, or offer to buy or sell any securities, franchises, or other financial instruments, particularly in jurisdictions where such activity would be unlawful.
All content is of a general nature and may not address the specific circumstances of any individual or entity. It is not a substitute for professional advice or services. Any actions you take based on the information provided here are strictly at your own risk. You accept full responsibility for any decisions or outcomes arising from your use of this website and agree to release us from any liability in connection with your use of, or reliance upon, the content or products found herein.