
|
Shenzhen Special Economic Zone Real Estate & Properties Co., Ltd. (000029.SZ) DCF Valuation |
Fully Editable: Tailor To Your Needs In Excel Or Sheets
Professional Design: Trusted, Industry-Standard Templates
Investor-Approved Valuation Models
MAC/PC Compatible, Fully Unlocked
No Expertise Is Needed; Easy To Follow
Shenzhen Special Economic Zone Real Estate & Properties (Group) Co., Ltd. (000029.SZ) Bundle
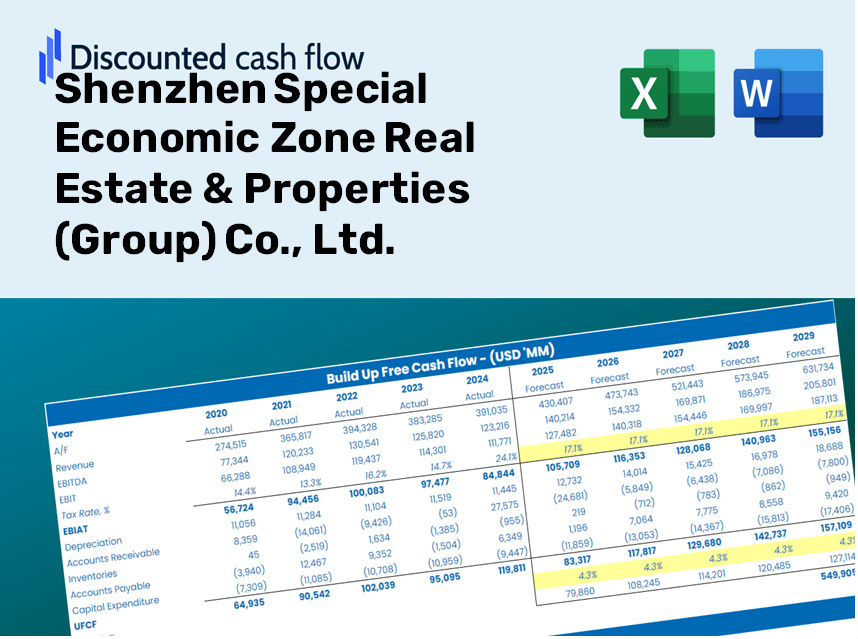
Evaluate Shenzhen Special Economic Zone Real Estate & Properties (Group) Co., Ltd. (000029SZ) financial outlook like an expert! This (000029SZ) DCF Calculator provides you with pre-filled financial data and the flexibility to modify revenue growth, WACC, margins, and other essential assumptions to align with your projections.
Discounted Cash Flow (DCF) - (USD MM)
| Year | AY1 2020 |
AY2 2021 |
AY3 2022 |
AY4 2023 |
AY5 2024 |
FY1 2025 |
FY2 2026 |
FY3 2027 |
FY4 2028 |
FY5 2029 |
|---|---|---|---|---|---|---|---|---|---|---|
| Revenue | 1,615.0 | 1,320.8 | 634.4 | 530.9 | 407.0 | 295.3 | 214.2 | 155.4 | 112.7 | 81.8 |
| Revenue Growth, % | 0 | -18.22 | -51.97 | -16.31 | -23.33 | -27.46 | -27.46 | -27.46 | -27.46 | -27.46 |
| EBITDA | 431.4 | 317.4 | 244.2 | -399.8 | -350.2 | -42.6 | -30.9 | -22.4 | -16.3 | -11.8 |
| EBITDA, % | 26.71 | 24.03 | 38.5 | -75.32 | -86.03 | -14.42 | -14.42 | -14.42 | -14.42 | -14.42 |
| Depreciation | 30.1 | 29.4 | 29.3 | 29.3 | 28.2 | 12.5 | 9.1 | 6.6 | 4.8 | 3.5 |
| Depreciation, % | 1.86 | 2.23 | 4.62 | 5.52 | 6.94 | 4.23 | 4.23 | 4.23 | 4.23 | 4.23 |
| EBIT | 401.3 | 288.0 | 214.9 | -429.1 | -378.4 | -55.1 | -40.0 | -29.0 | -21.0 | -15.3 |
| EBIT, % | 24.85 | 21.8 | 33.87 | -80.83 | -92.96 | -18.65 | -18.65 | -18.65 | -18.65 | -18.65 |
| Total Cash | 2,687.5 | 1,078.4 | 605.8 | 1,750.4 | 1,517.0 | 281.8 | 204.4 | 148.3 | 107.6 | 78.0 |
| Total Cash, percent | .0 | .0 | .0 | .0 | .0 | .0 | .0 | .0 | .0 | .0 |
| Account Receivables | 127.8 | 95.2 | 65.1 | 102.5 | 95.1 | 40.2 | 29.1 | 21.1 | 15.3 | 11.1 |
| Account Receivables, % | 7.91 | 7.21 | 10.26 | 19.3 | 23.36 | 13.61 | 13.61 | 13.61 | 13.61 | 13.61 |
| Inventories | 1,220.5 | 4,034.9 | 4,257.1 | 3,915.2 | 3,636.8 | 280.8 | 203.7 | 147.8 | 107.2 | 77.8 |
| Inventories, % | 75.57 | 305.49 | 671.06 | 737.48 | 893.52 | 95.11 | 95.11 | 95.11 | 95.11 | 95.11 |
| Accounts Payable | 176.9 | 388.8 | 434.6 | 443.3 | 464.5 | 172.7 | 125.3 | 90.9 | 65.9 | 47.8 |
| Accounts Payable, % | 10.96 | 29.44 | 68.51 | 83.49 | 114.12 | 58.48 | 58.48 | 58.48 | 58.48 | 58.48 |
| Capital Expenditure | -.7 | -1.8 | -.7 | -1.5 | -1.5 | -.6 | -.4 | -.3 | -.2 | -.2 |
| Capital Expenditure, % | -0.04639076 | -0.13973 | -0.11248 | -0.27791 | -0.38016 | -0.19133 | -0.19133 | -0.19133 | -0.19133 | -0.19133 |
| Tax Rate, % | 53.62 | 53.62 | 53.62 | 53.62 | 53.62 | 53.62 | 53.62 | 53.62 | 53.62 | 53.62 |
| EBITAT | 290.9 | 222.0 | 153.2 | -250.0 | -175.5 | -35.9 | -26.0 | -18.9 | -13.7 | -9.9 |
| Depreciation | ||||||||||
| Changes in Account Receivables | ||||||||||
| Changes in Inventories | ||||||||||
| Changes in Accounts Payable | ||||||||||
| Capital Expenditure | ||||||||||
| UFCF | -851.1 | -2,320.4 | 35.5 | 91.1 | 158.1 | 3,095.2 | 23.4 | 17.0 | 12.3 | 8.9 |
| WACC, % | 6.76 | 6.76 | 6.76 | 6.76 | 6.76 | 6.76 | 6.76 | 6.76 | 6.76 | 6.76 |
| PV UFCF | ||||||||||
| SUM PV UFCF | 2,949.5 | |||||||||
| Long Term Growth Rate, % | 4.00 | |||||||||
| Free cash flow (T + 1) | 9 | |||||||||
| Terminal Value | 336 | |||||||||
| Present Terminal Value | 242 | |||||||||
| Enterprise Value | 3,192 | |||||||||
| Net Debt | -465 | |||||||||
| Equity Value | 3,657 | |||||||||
| Diluted Shares Outstanding, MM | 1,012 | |||||||||
| Equity Value Per Share | 3.61 |
What You Will Receive
- Customizable Excel Template: A fully modifiable Excel-based DCF Calculator featuring pre-populated real financial data for Shenzhen Special Economic Zone Real Estate & Properties (Group) Co., Ltd. (000029SZ).
- Actual Data: Access to historical figures and forward-looking projections (highlighted in the yellow cells).
- Flexible Forecasting: Adjust key assumptions such as revenue growth, EBITDA percentage, and WACC with ease.
- Instant Calculations: See the immediate effect of your inputs on the valuation of Shenzhen Special Economic Zone Real Estate & Properties (Group) Co., Ltd. (000029SZ).
- Professional Resource: Designed specifically for investors, CFOs, consultants, and financial analysts.
- User-Friendly Interface: Organized for simplicity and usability, complete with step-by-step guidance.
Key Features
- 🔍 Real-Life 000029SZ Financials: Pre-filled historical and projected data for Shenzhen Special Economic Zone Real Estate & Properties (Group) Co., Ltd.
- ✏️ Fully Customizable Inputs: Adjust all critical parameters (yellow cells) such as WACC, growth %, and tax rates to fit your analysis.
- 📊 Professional DCF Valuation: Integrated formulas determine the intrinsic value of Shenzhen Special Economic Zone Real Estate & Properties (Group) Co., Ltd. using the Discounted Cash Flow method.
- ⚡ Instant Results: See the valuation of Shenzhen Special Economic Zone Real Estate & Properties (Group) Co., Ltd. immediately after adjustments.
- Scenario Analysis: Evaluate and compare different financial assumptions and their impacts side-by-side.
How It Functions
- 1. Access the Template: Download and open the Excel file featuring Shenzhen Special Economic Zone Real Estate & Properties (Group) Co., Ltd. (000029SZ) data.
- 2. Modify Assumptions: Adjust essential inputs such as growth rates, WACC, and capital expenditures.
- 3. Instant Results: The DCF model automatically calculates intrinsic value and NPV based on your inputs.
- 4. Explore Scenarios: Analyze various forecasts to assess different valuation possibilities.
- 5. Present with Assurance: Share professional valuation findings to enhance your decision-making process.
Why Choose This Calculator for Shenzhen Special Economic Zone Real Estate & Properties (Group) Co., Ltd. (000029SZ)?
- Designed for Industry Experts: A sophisticated tool utilized by real estate analysts, CFOs, and property consultants.
- Accurate Market Data: Historical and forecasted financial figures for Shenzhen Special Economic Zone Real Estate preloaded for precise analysis.
- Flexible Scenario Analysis: Easily test various market forecasts and assumptions.
- Clear and Concise Results: Automatically computes intrinsic value, net present value (NPV), and other crucial metrics.
- User-Friendly Interface: Comprehensive step-by-step guidance to assist you throughout the entire process.
Who Should Use This Product?
- Real Estate Investors: Develop comprehensive and accurate valuation models for property analysis using Shenzhen Special Economic Zone Real Estate & Properties (Group) Co., Ltd. (000029SZ).
- Corporate Finance Teams: Explore valuation scenarios to inform strategic decisions within real estate projects.
- Consultants and Advisors: Deliver precise valuation insights to clients investing in the real estate sector.
- Students and Educators: Utilize real-world market data to enhance financial modeling skills in real estate coursework.
- Property Enthusiasts: Gain insights into how real estate companies like Shenzhen Special Economic Zone Real Estate & Properties (Group) Co., Ltd. (000029SZ) are valued within the market.
What the Template Contains
- Operating and Balance Sheet Data: Pre-filled historical data and forecasts for Shenzhen Special Economic Zone Real Estate & Properties (Group) Co., Ltd. (000029SZ), including revenue, EBITDA, EBIT, and capital expenditures.
- WACC Calculation: A dedicated sheet for Weighted Average Cost of Capital (WACC), featuring key parameters such as Beta, risk-free rate, and share price.
- DCF Valuation (Unlevered and Levered): Customizable Discounted Cash Flow models that illustrate intrinsic value with comprehensive calculations.
- Financial Statements: Pre-loaded annual and quarterly financial statements to facilitate thorough analysis.
- Key Ratios: A range of profitability, leverage, and efficiency ratios relevant to Shenzhen Special Economic Zone Real Estate & Properties (Group) Co., Ltd. (000029SZ).
- Dashboard and Charts: A visual summary of valuation outputs and assumptions for easy result analysis.
Disclaimer
All information, articles, and product details provided on this website are for general informational and educational purposes only. We do not claim any ownership over, nor do we intend to infringe upon, any trademarks, copyrights, logos, brand names, or other intellectual property mentioned or depicted on this site. Such intellectual property remains the property of its respective owners, and any references here are made solely for identification or informational purposes, without implying any affiliation, endorsement, or partnership.
We make no representations or warranties, express or implied, regarding the accuracy, completeness, or suitability of any content or products presented. Nothing on this website should be construed as legal, tax, investment, financial, medical, or other professional advice. In addition, no part of this site—including articles or product references—constitutes a solicitation, recommendation, endorsement, advertisement, or offer to buy or sell any securities, franchises, or other financial instruments, particularly in jurisdictions where such activity would be unlawful.
All content is of a general nature and may not address the specific circumstances of any individual or entity. It is not a substitute for professional advice or services. Any actions you take based on the information provided here are strictly at your own risk. You accept full responsibility for any decisions or outcomes arising from your use of this website and agree to release us from any liability in connection with your use of, or reliance upon, the content or products found herein.