
|
North Huajin Chemical Industries Co.,Ltd (000059.SZ) DCF Valuation |
Fully Editable: Tailor To Your Needs In Excel Or Sheets
Professional Design: Trusted, Industry-Standard Templates
Investor-Approved Valuation Models
MAC/PC Compatible, Fully Unlocked
No Expertise Is Needed; Easy To Follow
North Huajin Chemical Industries Co.,Ltd (000059.SZ) Bundle
Looking to determine the intrinsic value of North Huajin Chemical Industries Co., Ltd? Our (000059SZ) DCF Calculator integrates real-world data with extensive customization features, enabling you to adjust forecasts and enhance your investment strategies.
Discounted Cash Flow (DCF) - (USD MM)
| Year | AY1 2020 |
AY2 2021 |
AY3 2022 |
AY4 2023 |
AY5 2024 |
FY1 2025 |
FY2 2026 |
FY3 2027 |
FY4 2028 |
FY5 2029 |
|---|---|---|---|---|---|---|---|---|---|---|
| Revenue | 30,437.4 | 38,648.1 | 49,062.1 | 46,142.0 | 34,596.1 | 31,536.0 | 28,746.5 | 26,203.8 | 23,886.0 | 21,773.2 |
| Revenue Growth, % | 0 | 26.98 | 26.95 | -5.95 | -25.02 | -8.85 | -8.85 | -8.85 | -8.85 | -8.85 |
| EBITDA | 2,194.5 | 3,012.9 | 2,572.5 | 1,791.9 | -1,652.6 | 1,220.8 | 1,112.8 | 1,014.4 | 924.7 | 842.9 |
| EBITDA, % | 7.21 | 7.8 | 5.24 | 3.88 | -4.78 | 3.87 | 3.87 | 3.87 | 3.87 | 3.87 |
| Depreciation | 1,377.6 | 1,454.9 | 1,553.2 | 1,523.6 | 1,102.6 | 1,131.8 | 1,031.7 | 940.5 | 857.3 | 781.4 |
| Depreciation, % | 4.53 | 3.76 | 3.17 | 3.3 | 3.19 | 3.59 | 3.59 | 3.59 | 3.59 | 3.59 |
| EBIT | 816.9 | 1,558.0 | 1,019.3 | 268.4 | -2,755.2 | 88.9 | 81.1 | 73.9 | 67.4 | 61.4 |
| EBIT, % | 2.68 | 4.03 | 2.08 | 0.58159 | -7.96 | 0.28206 | 0.28206 | 0.28206 | 0.28206 | 0.28206 |
| Total Cash | 7,766.9 | 9,568.9 | 10,040.0 | 9,429.3 | 8,077.0 | 7,223.2 | 6,584.3 | 6,001.9 | 5,471.0 | 4,987.0 |
| Total Cash, percent | .0 | .0 | .0 | .0 | .0 | .0 | .0 | .0 | .0 | .0 |
| Account Receivables | 434.6 | 330.1 | 235.9 | 307.7 | 133.0 | 240.5 | 219.3 | 199.9 | 182.2 | 166.1 |
| Account Receivables, % | 1.43 | 0.85407 | 0.4809 | 0.66675 | 0.38433 | 0.76276 | 0.76276 | 0.76276 | 0.76276 | 0.76276 |
| Inventories | 2,839.2 | 4,463.8 | 5,103.8 | 5,817.3 | 5,184.8 | 3,713.3 | 3,384.9 | 3,085.5 | 2,812.6 | 2,563.8 |
| Inventories, % | 9.33 | 11.55 | 10.4 | 12.61 | 14.99 | 11.77 | 11.77 | 11.77 | 11.77 | 11.77 |
| Accounts Payable | 856.1 | 2,052.4 | 2,899.5 | 3,756.9 | 101.6 | 1,417.1 | 1,291.8 | 1,177.5 | 1,073.4 | 978.4 |
| Accounts Payable, % | 2.81 | 5.31 | 5.91 | 8.14 | 0.29375 | 4.49 | 4.49 | 4.49 | 4.49 | 4.49 |
| Capital Expenditure | -326.5 | -364.5 | -205.2 | -317.9 | -977.1 | -375.1 | -341.9 | -311.7 | -284.1 | -259.0 |
| Capital Expenditure, % | -1.07 | -0.94309 | -0.41827 | -0.68899 | -2.82 | -1.19 | -1.19 | -1.19 | -1.19 | -1.19 |
| Tax Rate, % | 1.53 | 1.53 | 1.53 | 1.53 | 1.53 | 1.53 | 1.53 | 1.53 | 1.53 | 1.53 |
| EBITAT | 657.6 | 1,265.9 | 655.8 | 122.0 | -2,713.0 | 65.8 | 60.0 | 54.7 | 49.9 | 45.4 |
| Depreciation | ||||||||||
| Changes in Account Receivables | ||||||||||
| Changes in Inventories | ||||||||||
| Changes in Accounts Payable | ||||||||||
| Capital Expenditure | ||||||||||
| UFCF | -709.1 | 2,032.5 | 2,305.1 | 1,399.8 | -5,435.6 | 3,501.9 | 974.2 | 888.0 | 809.5 | 737.9 |
| WACC, % | 5 | 5.02 | 4.71 | 4.36 | 5.33 | 4.89 | 4.89 | 4.89 | 4.89 | 4.89 |
| PV UFCF | ||||||||||
| SUM PV UFCF | 6,244.1 | |||||||||
| Long Term Growth Rate, % | 2.00 | |||||||||
| Free cash flow (T + 1) | 753 | |||||||||
| Terminal Value | 26,081 | |||||||||
| Present Terminal Value | 20,546 | |||||||||
| Enterprise Value | 26,790 | |||||||||
| Net Debt | 65 | |||||||||
| Equity Value | 26,726 | |||||||||
| Diluted Shares Outstanding, MM | 1,599 | |||||||||
| Equity Value Per Share | 16.71 |
What You Will Receive
- Customizable Excel Template: A fully adjustable Excel-based DCF Calculator featuring pre-filled real financial data for North Huajin Chemical Industries Co., Ltd (000059SZ).
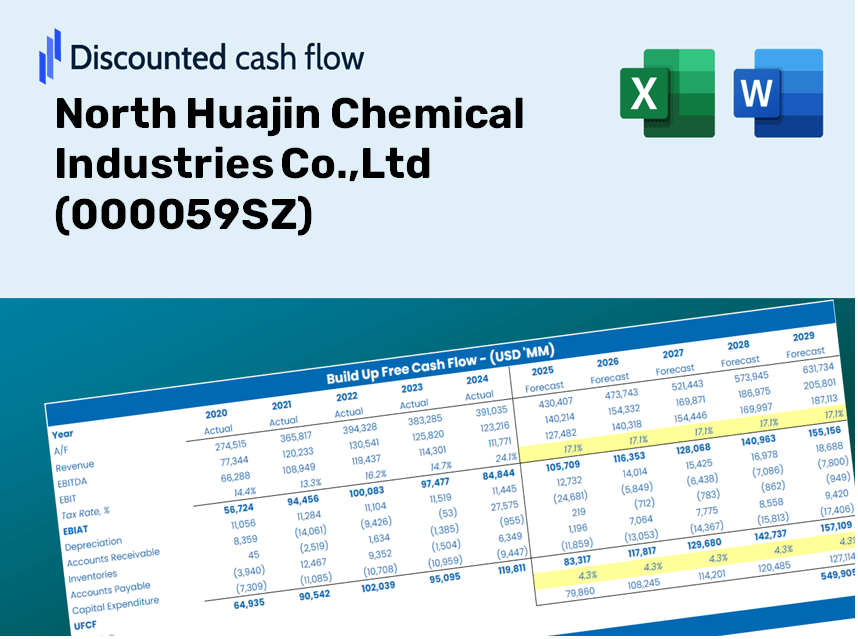
- Accurate Historical Data: Access to historical performance data and forward-looking projections (highlighted in the yellow cells).
- Assumption Flexibility: Modify key forecast variables such as revenue growth, EBITDA margin, and WACC.
- Instant Calculations: See real-time effects of your inputs on the valuation of North Huajin Chemical Industries Co., Ltd (000059SZ).
- Professional-Grade Tool: Designed for investors, CFOs, consultants, and financial analysts.
- User-Friendly Layout: Organized for simplicity and ease of navigation, complete with step-by-step guidance.
Key Features
- Customizable Forecast Inputs: Adjust essential metrics such as revenue growth, EBITDA margin, and capital investments.
- Instant DCF Valuation: Automatically computes intrinsic value, NPV, and other important financial metrics.
- High-Precision Accuracy: Leverages North Huajin Chemical Industries’ real-world financial data for credible valuation results.
- Effortless Scenario Analysis: Evaluate various assumptions and assess results with ease.
- Efficiency Booster: Remove the necessity of crafting intricate valuation models from the ground up.
How It Functions
- Step 1: Download the Excel file.
- Step 2: Examine the pre-filled data for North Huajin Chemical Industries Co., Ltd (000059SZ), including both historical and projected figures.
- Step 3: Modify key assumptions (highlighted in yellow) according to your analysis.
- Step 4: Observe the automatic updates for North Huajin's intrinsic value.
- Step 5: Utilize the results for your investment strategies or reporting needs.
Why Choose This Calculator for North Huajin Chemical Industries Co., Ltd (000059SZ)?
- User-Friendly Interface: Perfect for both novices and seasoned analysts.
- Customizable Inputs: Easily adjust parameters to tailor your analysis.
- Real-Time Valuation: Watch immediate updates to North Huajin's valuation as you tweak inputs.
- Preloaded Financial Data: Comes with North Huajin's actual financial metrics for swift evaluations.
- Preferred by Industry Experts: Trusted by investors and analysts for making sound decisions.
Who Should Use This Product?
- Investors: Assess the intrinsic value of North Huajin Chemical Industries Co., Ltd (000059SZ) before making investment choices.
- CFOs: Utilize a robust DCF model for accurate financial reporting and analysis.
- Consultants: Easily customize the template for valuation reports tailored to clients.
- Entrepreneurs: Acquire knowledge of financial modeling techniques employed by leading industry players.
- Educators: Employ it as a resource to illustrate valuation strategies in the classroom.
What the Template Includes
- Historical Data: Comprises North Huajin Chemical Industries Co., Ltd's past financial performance and baseline forecasts.
- DCF and Levered DCF Models: Comprehensive templates to determine the intrinsic value of North Huajin Chemical Industries (000059SZ).
- WACC Sheet: Pre-constructed calculations for the Weighted Average Cost of Capital.
- Editable Inputs: Customize key factors such as growth rates, EBITDA percentages, and CAPEX assumptions.
- Quarterly and Annual Statements: A thorough analysis of North Huajin Chemical Industries’ financials.
- Interactive Dashboard: Dynamically visualize valuation outcomes and projections.
Disclaimer
All information, articles, and product details provided on this website are for general informational and educational purposes only. We do not claim any ownership over, nor do we intend to infringe upon, any trademarks, copyrights, logos, brand names, or other intellectual property mentioned or depicted on this site. Such intellectual property remains the property of its respective owners, and any references here are made solely for identification or informational purposes, without implying any affiliation, endorsement, or partnership.
We make no representations or warranties, express or implied, regarding the accuracy, completeness, or suitability of any content or products presented. Nothing on this website should be construed as legal, tax, investment, financial, medical, or other professional advice. In addition, no part of this site—including articles or product references—constitutes a solicitation, recommendation, endorsement, advertisement, or offer to buy or sell any securities, franchises, or other financial instruments, particularly in jurisdictions where such activity would be unlawful.
All content is of a general nature and may not address the specific circumstances of any individual or entity. It is not a substitute for professional advice or services. Any actions you take based on the information provided here are strictly at your own risk. You accept full responsibility for any decisions or outcomes arising from your use of this website and agree to release us from any liability in connection with your use of, or reliance upon, the content or products found herein.