
|
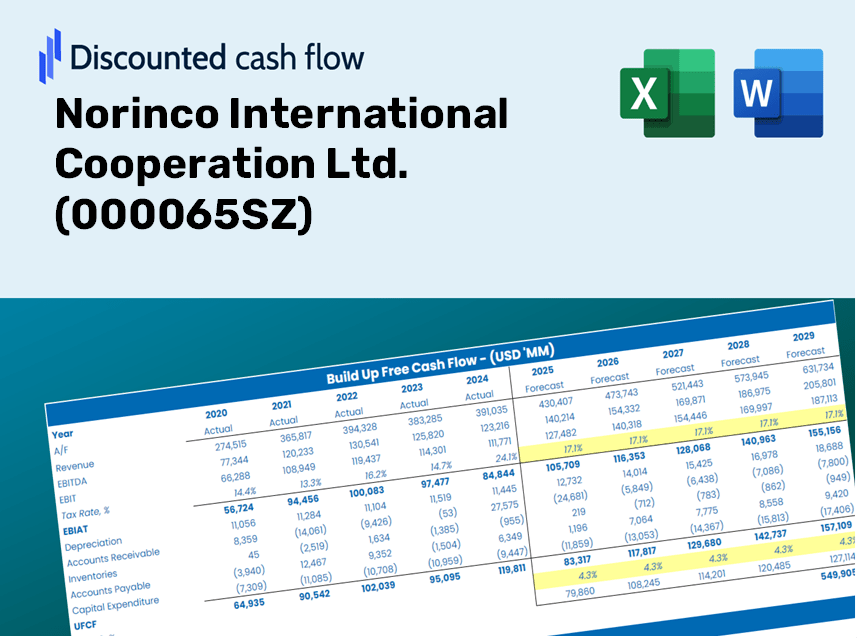
Norinco International Cooperation Ltd. (000065.SZ) DCF Valuation |
Fully Editable: Tailor To Your Needs In Excel Or Sheets
Professional Design: Trusted, Industry-Standard Templates
Investor-Approved Valuation Models
MAC/PC Compatible, Fully Unlocked
No Expertise Is Needed; Easy To Follow
Norinco International Cooperation Ltd. (000065.SZ) Bundle
Evaluate the financial prospects of Norinco International Cooperation Ltd. like an expert! This (000065SZ) DCF Calculator provides pre-loaded financial data along with the flexibility to modify revenue growth, WACC, margins, and other essential assumptions to align with your predictions.
Discounted Cash Flow (DCF) - (USD MM)
| Year | AY1 2020 |
AY2 2021 |
AY3 2022 |
AY4 2023 |
AY5 2024 |
FY1 2025 |
FY2 2026 |
FY3 2027 |
FY4 2028 |
FY5 2029 |
|---|---|---|---|---|---|---|---|---|---|---|
| Revenue | 12,850.7 | 13,050.0 | 13,433.3 | 21,487.9 | 19,079.9 | 21,453.6 | 24,122.5 | 27,123.4 | 30,497.7 | 34,291.8 |
| Revenue Growth, % | 0 | 1.55 | 2.94 | 59.96 | -11.21 | 12.44 | 12.44 | 12.44 | 12.44 | 12.44 |
| EBITDA | 878.6 | 942.7 | 1,190.7 | 1,330.1 | 1,417.0 | 1,567.9 | 1,762.9 | 1,982.3 | 2,228.9 | 2,506.2 |
| EBITDA, % | 6.84 | 7.22 | 8.86 | 6.19 | 7.43 | 7.31 | 7.31 | 7.31 | 7.31 | 7.31 |
| Depreciation | 138.7 | 136.9 | 234.7 | 249.3 | 319.5 | 287.9 | 323.7 | 364.0 | 409.3 | 460.2 |
| Depreciation, % | 1.08 | 1.05 | 1.75 | 1.16 | 1.67 | 1.34 | 1.34 | 1.34 | 1.34 | 1.34 |
| EBIT | 739.9 | 805.8 | 956.0 | 1,080.8 | 1,097.5 | 1,280.0 | 1,439.2 | 1,618.3 | 1,819.6 | 2,045.9 |
| EBIT, % | 5.76 | 6.17 | 7.12 | 5.03 | 5.75 | 5.97 | 5.97 | 5.97 | 5.97 | 5.97 |
| Total Cash | 5,142.1 | 4,091.5 | 4,980.9 | 4,092.5 | 4,600.2 | 6,504.8 | 7,314.1 | 8,224.0 | 9,247.1 | 10,397.4 |
| Total Cash, percent | .0 | .0 | .0 | .0 | .0 | .0 | .0 | .0 | .0 | .0 |
| Account Receivables | 4,755.8 | 5,162.1 | 5,243.3 | .0 | 5,426.7 | 6,180.3 | 6,949.1 | 7,813.6 | 8,785.7 | 9,878.7 |
| Account Receivables, % | 37.01 | 39.56 | 39.03 | 0 | 28.44 | 28.81 | 28.81 | 28.81 | 28.81 | 28.81 |
| Inventories | 666.5 | 991.3 | 937.6 | 1,362.9 | 1,564.3 | 1,471.9 | 1,655.0 | 1,860.9 | 2,092.4 | 2,352.7 |
| Inventories, % | 5.19 | 7.6 | 6.98 | 6.34 | 8.2 | 6.86 | 6.86 | 6.86 | 6.86 | 6.86 |
| Accounts Payable | 4,854.0 | 6,117.1 | 5,874.6 | 4,357.6 | 6,083.0 | 7,746.4 | 8,710.1 | 9,793.7 | 11,012.1 | 12,382.1 |
| Accounts Payable, % | 37.77 | 46.87 | 43.73 | 20.28 | 31.88 | 36.11 | 36.11 | 36.11 | 36.11 | 36.11 |
| Capital Expenditure | -782.5 | -698.9 | -318.8 | -187.2 | -184.2 | -671.7 | -755.3 | -849.2 | -954.9 | -1,073.7 |
| Capital Expenditure, % | -6.09 | -5.36 | -2.37 | -0.871 | -0.96566 | -3.13 | -3.13 | -3.13 | -3.13 | -3.13 |
| Tax Rate, % | 9.64 | 9.64 | 9.64 | 9.64 | 9.64 | 9.64 | 9.64 | 9.64 | 9.64 | 9.64 |
| EBITAT | 615.6 | 622.8 | 629.9 | 890.7 | 991.7 | 1,021.8 | 1,148.9 | 1,291.8 | 1,452.5 | 1,633.2 |
| Depreciation | ||||||||||
| Changes in Account Receivables | ||||||||||
| Changes in Inventories | ||||||||||
| Changes in Accounts Payable | ||||||||||
| Capital Expenditure | ||||||||||
| UFCF | -596.5 | 592.7 | 275.9 | 4,253.7 | -2,775.7 | 1,640.3 | 729.1 | 819.8 | 921.8 | 1,036.4 |
| WACC, % | 7.45 | 7.35 | 7.16 | 7.43 | 7.57 | 7.39 | 7.39 | 7.39 | 7.39 | 7.39 |
| PV UFCF | ||||||||||
| SUM PV UFCF | 4,240.0 | |||||||||
| Long Term Growth Rate, % | 2.00 | |||||||||
| Free cash flow (T + 1) | 1,057 | |||||||||
| Terminal Value | 19,607 | |||||||||
| Present Terminal Value | 13,726 | |||||||||
| Enterprise Value | 17,966 | |||||||||
| Net Debt | -1,383 | |||||||||
| Equity Value | 19,349 | |||||||||
| Diluted Shares Outstanding, MM | 1,039 | |||||||||
| Equity Value Per Share | 18.62 |
What You Will Receive
- Authentic NORINCO Financial Data: Pre-filled with Norinco International Cooperation Ltd.'s historical and projected metrics for accurate analysis.
- Fully Customizable Template: Easily adjust key parameters such as revenue growth, WACC, and EBITDA percentage.
- Instant Calculations: Watch as the intrinsic value of Norinco updates automatically with your modifications.
- Professional Valuation Tool: Crafted for investors, analysts, and consultants who demand precise DCF outcomes.
- User-Friendly Interface: Designed with a straightforward layout and clear guidance suitable for all skill levels.
Key Features
- Authentic Norinco Data: Pre-filled with Norinco International Cooperation Ltd.'s historical financial performance and future projections.
- Customizable Parameters: Tailor revenue growth rates, profit margins, WACC, tax rates, and capital expenditures to your needs.
- Adaptive Valuation Model: Automatically refreshes the Net Present Value (NPV) and intrinsic value calculations based on your customized inputs.
- Scenario Analysis: Generate various forecast scenarios to evaluate different valuation possibilities.
- Intuitive User Interface: Designed for ease of use, making it accessible for both professionals and newcomers.
How It Operates
- Download: Obtain the pre-prepared Excel file containing Norinco International Cooperation Ltd. (000065SZ) financial data.
- Customize: Modify forecasts, such as revenue growth, EBITDA %, and WACC.
- Update Automatically: The intrinsic value and NPV calculations refresh in real-time.
- Test Scenarios: Generate various projections and instantly compare their outcomes.
- Make Decisions: Utilize the valuation results to inform your investment strategy.
Why Opt for This Calculator?
- All-in-One Solution: Features DCF, WACC, and financial ratio analyses seamlessly integrated.
- Flexible Inputs: Modify the yellow-highlighted fields to explore different scenarios.
- In-Depth Analysis: Automatically computes the intrinsic value and Net Present Value for Norinco International Cooperation Ltd. (000065SZ).
- Pre-Loaded Information: Access historical and projected data for reliable starting points.
- High-Quality Standards: Perfect for financial analysts, investors, and business consultants seeking precise insights.
Who Should Utilize This Product?
- Professional Investors: Create comprehensive and accurate valuation models for analyzing portfolios involving Norinco International Cooperation Ltd. (000065SZ).
- Corporate Finance Teams: Assess valuation scenarios to inform and shape internal business strategies for Norinco International Cooperation Ltd. (000065SZ).
- Consultants and Advisors: Offer clients precise valuation insights related to Norinco International Cooperation Ltd. (000065SZ).
- Students and Educators: Leverage real-world data to enhance learning and practice in financial modeling focused on Norinco International Cooperation Ltd. (000065SZ).
- Tech Enthusiasts: Gain insights into the valuation of companies like Norinco International Cooperation Ltd. (000065SZ) within the tech industry.
Contents of the Template
- Comprehensive DCF Model: Editable template featuring in-depth valuation calculations.
- Real-World Data: Historical and projected financials for Norinco International Cooperation Ltd. (000065SZ) preloaded for analysis.
- Customizable Parameters: Modify WACC, growth rates, and tax assumptions to explore different scenarios.
- Financial Statements: Detailed annual and quarterly breakdowns for enhanced insights.
- Key Ratios: Built-in analysis covering profitability, efficiency, and leverage metrics.
- Dashboard with Visual Outputs: Charts and tables to present clear and actionable results.
Disclaimer
All information, articles, and product details provided on this website are for general informational and educational purposes only. We do not claim any ownership over, nor do we intend to infringe upon, any trademarks, copyrights, logos, brand names, or other intellectual property mentioned or depicted on this site. Such intellectual property remains the property of its respective owners, and any references here are made solely for identification or informational purposes, without implying any affiliation, endorsement, or partnership.
We make no representations or warranties, express or implied, regarding the accuracy, completeness, or suitability of any content or products presented. Nothing on this website should be construed as legal, tax, investment, financial, medical, or other professional advice. In addition, no part of this site—including articles or product references—constitutes a solicitation, recommendation, endorsement, advertisement, or offer to buy or sell any securities, franchises, or other financial instruments, particularly in jurisdictions where such activity would be unlawful.
All content is of a general nature and may not address the specific circumstances of any individual or entity. It is not a substitute for professional advice or services. Any actions you take based on the information provided here are strictly at your own risk. You accept full responsibility for any decisions or outcomes arising from your use of this website and agree to release us from any liability in connection with your use of, or reliance upon, the content or products found herein.