
|
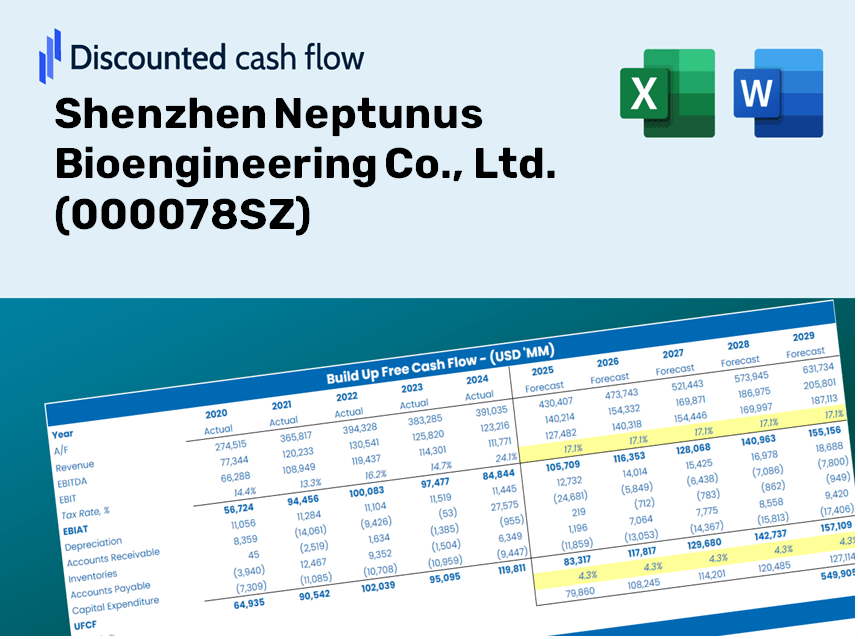
Shenzhen Neptunus Bioengineering Co., Ltd. (000078.SZ) DCF Valuation |
Fully Editable: Tailor To Your Needs In Excel Or Sheets
Professional Design: Trusted, Industry-Standard Templates
Investor-Approved Valuation Models
MAC/PC Compatible, Fully Unlocked
No Expertise Is Needed; Easy To Follow
Shenzhen Neptunus Bioengineering Co., Ltd. (000078.SZ) Bundle
Looking to assess the intrinsic value of Shenzhen Neptunus Bioengineering Co., Ltd.? Our (000078SZ) DCF Calculator integrates real-world data with comprehensive customization features, enabling you to refine your forecasts and enhance your investment choices.
Discounted Cash Flow (DCF) - (USD MM)
| Year | AY1 2020 |
AY2 2021 |
AY3 2022 |
AY4 2023 |
AY5 2024 |
FY1 2025 |
FY2 2026 |
FY3 2027 |
FY4 2028 |
FY5 2029 |
|---|---|---|---|---|---|---|---|---|---|---|
| Revenue | 40,022.5 | 41,053.6 | 37,834.9 | 36,418.8 | 30,317.3 | 28,364.8 | 26,538.1 | 24,829.0 | 23,230.0 | 21,733.9 |
| Revenue Growth, % | 0 | 2.58 | -7.84 | -3.74 | -16.75 | -6.44 | -6.44 | -6.44 | -6.44 | -6.44 |
| EBITDA | 1,421.1 | 1,722.6 | 523.2 | -141.5 | -27.5 | 490.7 | 459.1 | 429.6 | 401.9 | 376.0 |
| EBITDA, % | 3.55 | 4.2 | 1.38 | -0.38857 | -0.09065207 | 1.73 | 1.73 | 1.73 | 1.73 | 1.73 |
| Depreciation | 232.1 | 293.2 | 298.7 | 297.6 | 245.4 | 210.5 | 196.9 | 184.2 | 172.4 | 161.3 |
| Depreciation, % | 0.57999 | 0.71407 | 0.78961 | 0.81703 | 0.80958 | 0.74206 | 0.74206 | 0.74206 | 0.74206 | 0.74206 |
| EBIT | 1,189.0 | 1,429.4 | 224.4 | -439.1 | -272.9 | 280.3 | 262.2 | 245.3 | 229.5 | 214.7 |
| EBIT, % | 2.97 | 3.48 | 0.59323 | -1.21 | -0.90024 | 0.98803 | 0.98803 | 0.98803 | 0.98803 | 0.98803 |
| Total Cash | 5,607.0 | 4,162.2 | 3,318.6 | 3,674.8 | 3,581.7 | 3,110.1 | 2,909.8 | 2,722.4 | 2,547.1 | 2,383.1 |
| Total Cash, percent | .0 | .0 | .0 | .0 | .0 | .0 | .0 | .0 | .0 | .0 |
| Account Receivables | 22,743.1 | 22,718.4 | 22,158.0 | 20,555.8 | 18,207.6 | 16,294.4 | 15,245.0 | 14,263.2 | 13,344.6 | 12,485.2 |
| Account Receivables, % | 56.83 | 55.34 | 58.57 | 56.44 | 60.06 | 57.45 | 57.45 | 57.45 | 57.45 | 57.45 |
| Inventories | 3,905.4 | 3,792.9 | 4,193.0 | 3,679.5 | 3,486.9 | 2,932.0 | 2,743.2 | 2,566.5 | 2,401.2 | 2,246.6 |
| Inventories, % | 9.76 | 9.24 | 11.08 | 10.1 | 11.5 | 10.34 | 10.34 | 10.34 | 10.34 | 10.34 |
| Accounts Payable | 10,727.6 | 10,055.5 | 10,059.7 | 9,974.1 | 9,102.9 | 7,675.5 | 7,181.1 | 6,718.7 | 6,286.0 | 5,881.2 |
| Accounts Payable, % | 26.8 | 24.49 | 26.59 | 27.39 | 30.03 | 27.06 | 27.06 | 27.06 | 27.06 | 27.06 |
| Capital Expenditure | -147.3 | -129.2 | -94.3 | -104.1 | -84.6 | -84.9 | -79.5 | -74.3 | -69.5 | -65.1 |
| Capital Expenditure, % | -0.36803 | -0.31477 | -0.24929 | -0.28577 | -0.27905 | -0.29938 | -0.29938 | -0.29938 | -0.29938 | -0.29938 |
| Tax Rate, % | -10.33 | -10.33 | -10.33 | -10.33 | -10.33 | -10.33 | -10.33 | -10.33 | -10.33 | -10.33 |
| EBITAT | -183.6 | 639.6 | 261.0 | -508.7 | -301.1 | 193.2 | 180.8 | 169.1 | 158.3 | 148.1 |
| Depreciation | ||||||||||
| Changes in Account Receivables | ||||||||||
| Changes in Inventories | ||||||||||
| Changes in Accounts Payable | ||||||||||
| Capital Expenditure | ||||||||||
| UFCF | -16,019.5 | 268.5 | 629.9 | 1,714.9 | 1,529.3 | 1,359.5 | 1,042.2 | 975.0 | 912.2 | 853.5 |
| WACC, % | 1.96 | 4.21 | 7 | 7 | 7 | 5.43 | 5.43 | 5.43 | 5.43 | 5.43 |
| PV UFCF | ||||||||||
| SUM PV UFCF | 4,452.1 | |||||||||
| Long Term Growth Rate, % | 3.30 | |||||||||
| Free cash flow (T + 1) | 882 | |||||||||
| Terminal Value | 41,298 | |||||||||
| Present Terminal Value | 31,696 | |||||||||
| Enterprise Value | 36,148 | |||||||||
| Net Debt | 6,897 | |||||||||
| Equity Value | 29,251 | |||||||||
| Diluted Shares Outstanding, MM | 2,631 | |||||||||
| Equity Value Per Share | 11.12 |
What You Will Receive
- Comprehensive Financial Model: Leverage Shenzhen Neptunus Bioengineering Co., Ltd.’s actual data for accurate DCF valuation.
- Complete Forecasting Control: Modify revenue growth, profit margins, WACC, and other critical variables.
- Real-Time Calculations: Automatic updates provide immediate feedback as changes are made.
- Professional-Grade Template: A polished Excel file crafted for high-quality valuation analysis.
- Adaptable and Reusable: Designed for versatility, enabling repeated application for detailed forecasts.
Core Benefits
- Customizable Financial Inputs: Adjust essential parameters such as revenue growth, EBITDA %, and capital expenditures.
- Instant DCF Valuation: Automatically computes intrinsic value, NPV, and various financial metrics.
- High-Precision Accuracy: Utilizes Shenzhen Neptunus Bioengineering Co., Ltd.'s (000078SZ) actual financial data for dependable valuation results.
- Simplified Scenario Testing: Effortlessly explore different assumptions and evaluate outcomes.
- Efficiency Booster: Remove the hassle of constructing complex valuation models from the ground up.
How It Functions
- Step 1: Download the Excel spreadsheet.
- Step 2: Examine Shenzhen Neptunus Bioengineering Co., Ltd.'s pre-filled financial information and projections.
- Step 3: Adjust essential parameters such as revenue growth, WACC, and tax rates (marked cells).
- Step 4: Observe the DCF model refresh in real-time as you modify your assumptions.
- Step 5: Evaluate the results and leverage the findings for your investment strategies.
Why Opt for This Calculator?
- Designed for Experts: A sophisticated tool tailored for analysts, CFOs, and consultants.
- Accurate Data: Historical and projected financial information for Shenzhen Neptunus Bioengineering (000078SZ) preloaded for precision.
- Flexible Scenario Analysis: Effortlessly model various forecasts and assumptions.
- Transparent Results: Automatically computes intrinsic value, NPV, and essential metrics.
- User-Friendly: Comprehensive step-by-step guidance to navigate the process.
Who Can Benefit from This Product?
- Professional Investors: Develop comprehensive and trustworthy valuation models for analyzing portfolios related to Shenzhen Neptunus Bioengineering Co., Ltd. (000078SZ).
- Corporate Finance Teams: Evaluate valuation scenarios to inform strategic decisions within the organization.
- Consultants and Advisors: Deliver precise valuation insights to clients interested in the stock of Shenzhen Neptunus Bioengineering Co., Ltd. (000078SZ).
- Students and Educators: Utilize real-time data to enhance learning and practice in financial modeling.
- Biotech Enthusiasts: Gain insights into how biotech firms like Shenzhen Neptunus Bioengineering Co., Ltd. (000078SZ) are valued in the stock market.
Contents of the Template
- Pre-Filled Data: Contains Shenzhen Neptunus Bioengineering Co., Ltd.'s historical financials and projections.
- Discounted Cash Flow Model: An editable DCF valuation model featuring automatic calculations.
- Weighted Average Cost of Capital (WACC): A dedicated worksheet for WACC calculation based on customized inputs.
- Key Financial Ratios: Examine Shenzhen Neptunus Bioengineering Co., Ltd.'s profitability, efficiency, and leverage metrics.
- Customizable Inputs: Easily adjust revenue growth, margins, and tax rates.
- Visual Dashboard: Charts and tables that summarize essential valuation outcomes.
Disclaimer
All information, articles, and product details provided on this website are for general informational and educational purposes only. We do not claim any ownership over, nor do we intend to infringe upon, any trademarks, copyrights, logos, brand names, or other intellectual property mentioned or depicted on this site. Such intellectual property remains the property of its respective owners, and any references here are made solely for identification or informational purposes, without implying any affiliation, endorsement, or partnership.
We make no representations or warranties, express or implied, regarding the accuracy, completeness, or suitability of any content or products presented. Nothing on this website should be construed as legal, tax, investment, financial, medical, or other professional advice. In addition, no part of this site—including articles or product references—constitutes a solicitation, recommendation, endorsement, advertisement, or offer to buy or sell any securities, franchises, or other financial instruments, particularly in jurisdictions where such activity would be unlawful.
All content is of a general nature and may not address the specific circumstances of any individual or entity. It is not a substitute for professional advice or services. Any actions you take based on the information provided here are strictly at your own risk. You accept full responsibility for any decisions or outcomes arising from your use of this website and agree to release us from any liability in connection with your use of, or reliance upon, the content or products found herein.