
|
Shenzhen Yan Tian Port Holdings Co.,Ltd. (000088.SZ) DCF Valuation |
Fully Editable: Tailor To Your Needs In Excel Or Sheets
Professional Design: Trusted, Industry-Standard Templates
Investor-Approved Valuation Models
MAC/PC Compatible, Fully Unlocked
No Expertise Is Needed; Easy To Follow
Shenzhen Yan Tian Port Holdings Co.,Ltd. (000088.SZ) Bundle
Designed for accuracy, our (000088SZ) DCF Calculator enables you to evaluate Shenzhen Yan Tian Port Holdings Co., Ltd. valuation using actual financial data and offers complete flexibility to modify all essential parameters for enhanced projections.
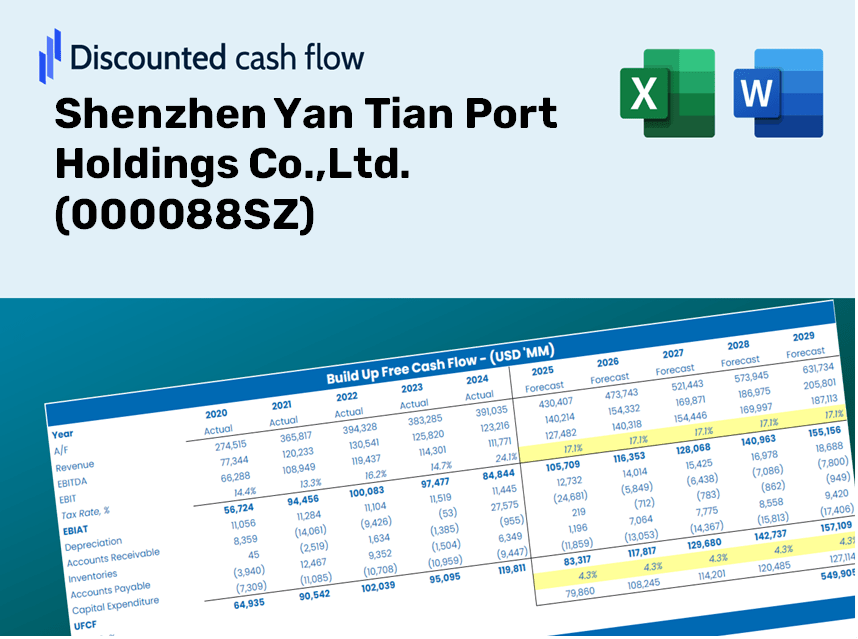
Discounted Cash Flow (DCF) - (USD MM)
| Year | AY1 2020 |
AY2 2021 |
AY3 2022 |
AY4 2023 |
AY5 2024 |
FY1 2025 |
FY2 2026 |
FY3 2027 |
FY4 2028 |
FY5 2029 |
|---|---|---|---|---|---|---|---|---|---|---|
| Revenue | 531.2 | 679.9 | 797.6 | 893.2 | 793.6 | 885.1 | 987.2 | 1,101.1 | 1,228.1 | 1,369.8 |
| Revenue Growth, % | 0 | 27.99 | 17.32 | 11.99 | -11.16 | 11.54 | 11.54 | 11.54 | 11.54 | 11.54 |
| EBITDA | 174.4 | 257.4 | 252.9 | 284.5 | 252.5 | 294.0 | 327.9 | 365.7 | 407.9 | 454.9 |
| EBITDA, % | 32.83 | 37.86 | 31.71 | 31.86 | 31.81 | 33.21 | 33.21 | 33.21 | 33.21 | 33.21 |
| Depreciation | 133.7 | 133.5 | 172.3 | 208.5 | 220.5 | 208.1 | 232.1 | 258.9 | 288.7 | 322.0 |
| Depreciation, % | 25.17 | 19.64 | 21.61 | 23.34 | 27.78 | 23.51 | 23.51 | 23.51 | 23.51 | 23.51 |
| EBIT | 40.7 | 123.9 | 80.6 | 76.0 | 32.0 | 85.9 | 95.8 | 106.9 | 119.2 | 132.9 |
| EBIT, % | 7.66 | 18.22 | 10.1 | 8.51 | 4.03 | 9.7 | 9.7 | 9.7 | 9.7 | 9.7 |
| Total Cash | 1,450.5 | 1,424.3 | 2,469.2 | 3,705.4 | 7,089.0 | 885.1 | 987.2 | 1,101.1 | 1,228.1 | 1,369.8 |
| Total Cash, percent | .0 | .0 | .0 | .0 | .0 | .0 | .0 | .0 | .0 | .0 |
| Account Receivables | 155.3 | 40.5 | 239.5 | 110.4 | 144.8 | 169.6 | 189.2 | 211.0 | 235.3 | 262.5 |
| Account Receivables, % | 29.23 | 5.96 | 30.02 | 12.36 | 18.25 | 19.16 | 19.16 | 19.16 | 19.16 | 19.16 |
| Inventories | 3.7 | 6.4 | 11.6 | 11.1 | 10.9 | 10.1 | 11.3 | 12.6 | 14.0 | 15.7 |
| Inventories, % | 0.70427 | 0.93654 | 1.45 | 1.24 | 1.38 | 1.14 | 1.14 | 1.14 | 1.14 | 1.14 |
| Accounts Payable | 590.2 | 682.6 | 725.0 | 767.2 | 758.3 | 836.2 | 932.6 | 1,040.2 | 1,160.2 | 1,294.0 |
| Accounts Payable, % | 111.11 | 100.4 | 90.9 | 85.89 | 95.56 | 94.47 | 94.47 | 94.47 | 94.47 | 94.47 |
| Capital Expenditure | -706.4 | -2,000.3 | -1,306.7 | -955.4 | -887.5 | -885.1 | -987.2 | -1,101.1 | -1,228.1 | -1,369.8 |
| Capital Expenditure, % | -132.99 | -294.23 | -163.83 | -106.97 | -111.84 | -100 | -100 | -100 | -100 | -100 |
| Tax Rate, % | 7.08 | 7.08 | 7.08 | 7.08 | 7.08 | 7.08 | 7.08 | 7.08 | 7.08 | 7.08 |
| EBITAT | 37.9 | 107.6 | 67.6 | 67.9 | 29.7 | 76.6 | 85.5 | 95.3 | 106.3 | 118.6 |
| Depreciation | ||||||||||
| Changes in Account Receivables | ||||||||||
| Changes in Inventories | ||||||||||
| Changes in Accounts Payable | ||||||||||
| Capital Expenditure | ||||||||||
| UFCF | -103.6 | -1,554.7 | -1,228.5 | -507.3 | -680.5 | -546.5 | -593.9 | -662.4 | -738.8 | -824.0 |
| WACC, % | 5.09 | 5.05 | 5.03 | 5.06 | 5.08 | 5.06 | 5.06 | 5.06 | 5.06 | 5.06 |
| PV UFCF | ||||||||||
| SUM PV UFCF | -2,879.7 | |||||||||
| Long Term Growth Rate, % | 2.00 | |||||||||
| Free cash flow (T + 1) | -841 | |||||||||
| Terminal Value | -27,460 | |||||||||
| Present Terminal Value | -21,453 | |||||||||
| Enterprise Value | -24,333 | |||||||||
| Net Debt | -1,775 | |||||||||
| Equity Value | -22,558 | |||||||||
| Diluted Shares Outstanding, MM | 4,498 | |||||||||
| Equity Value Per Share | -5.02 |
What You'll Receive
- Authentic 000088SZ Financials: Access to comprehensive historical and projected data for precise valuation.
- Customizable Parameters: Adjust WACC, tax rates, revenue growth, and capital expenditures as needed.
- Real-Time Calculations: Automatic computation of intrinsic value and NPV for immediate insights.
- Scenario Simulation: Explore various scenarios to assess Shenzhen Yan Tian Port's future prospects.
- User-Friendly Interface: Designed for industry professionals, yet easy to navigate for newcomers.
Key Features
- Customizable Financial Parameters: Adjust essential inputs such as revenue growth, EBITDA percentages, and capital expenditures.
- Instant DCF Valuation: Automatically computes intrinsic value, NPV, and various outputs in real time.
- High-Precision Accuracy: Incorporates Shenzhen Yan Tian Port Holdings Co., Ltd.'s (000088SZ) actual financial data to ensure realistic valuation results.
- Simplified Scenario Analysis: Effortlessly test varying assumptions and analyze differing outcomes.
- Efficiency Booster: Remove the hassle of constructing intricate valuation models from the ground up.
How It Functions
- Download the Template: Gain immediate access to the Excel-based SYT Port DCF Calculator.
- Input Your Assumptions: Modify the yellow-highlighted cells for growth rates, WACC, margins, and other key factors.
- Instant Calculations: The model automatically recalculates the intrinsic value of Shenzhen Yan Tian Port Holdings Co., Ltd. (000088SZ).
- Test Scenarios: Experiment with various assumptions to assess potential changes in valuation.
- Analyze and Decide: Leverage the results to inform your investment or financial evaluations.
Why Opt for This Calculator?
- Reliable Data: Accurate financials from Shenzhen Yan Tian Port Holdings Co., Ltd. guarantee dependable valuation outcomes.
- Tailored Options: Modify essential variables such as growth projections, WACC, and tax rates to suit your financial forecasts.
- Effortless Efficiency: Built-in calculations save you the hassle of starting from the ground up.
- Professional Quality Tool: Crafted for investors, analysts, and consultants in mind.
- Easy to Use: A user-friendly design and clear instructions make it accessible for all users.
Who Should Utilize This Product?
- Finance Students: Discover valuation methods and practice them with real-world data.
- Academics: Integrate industry-standard models into your teaching or research projects.
- Investors: Validate your investment hypotheses and evaluate valuation scenarios for Shenzhen Yan Tian Port Holdings Co., Ltd. (000088SZ).
- Analysts: Enhance your efficiency with a ready-to-use, customizable DCF model.
- Small Business Owners: Understand the analytical methods used to assess large publicly traded companies like Shenzhen Yan Tian Port Holdings Co., Ltd. (000088SZ).
What the Template Contains
- Historical Data: Provides insights into Shenzhen Yan Tian Port Holdings Co., Ltd.'s (000088SZ) past financial performance and baseline forecasts.
- DCF and Levered DCF Models: Comprehensive templates for determining the intrinsic value of Shenzhen Yan Tian Port Holdings Co., Ltd. (000088SZ).
- WACC Sheet: Pre-configured calculations for the Weighted Average Cost of Capital.
- Editable Inputs: Adjust critical assumptions such as growth rates, EBITDA percentages, and CAPEX estimates.
- Quarterly and Annual Statements: A thorough analysis of Shenzhen Yan Tian Port Holdings Co., Ltd.'s (000088SZ) financial data.
- Interactive Dashboard: Visual tools to dynamically illustrate valuation results and future projections.
Disclaimer
All information, articles, and product details provided on this website are for general informational and educational purposes only. We do not claim any ownership over, nor do we intend to infringe upon, any trademarks, copyrights, logos, brand names, or other intellectual property mentioned or depicted on this site. Such intellectual property remains the property of its respective owners, and any references here are made solely for identification or informational purposes, without implying any affiliation, endorsement, or partnership.
We make no representations or warranties, express or implied, regarding the accuracy, completeness, or suitability of any content or products presented. Nothing on this website should be construed as legal, tax, investment, financial, medical, or other professional advice. In addition, no part of this site—including articles or product references—constitutes a solicitation, recommendation, endorsement, advertisement, or offer to buy or sell any securities, franchises, or other financial instruments, particularly in jurisdictions where such activity would be unlawful.
All content is of a general nature and may not address the specific circumstances of any individual or entity. It is not a substitute for professional advice or services. Any actions you take based on the information provided here are strictly at your own risk. You accept full responsibility for any decisions or outcomes arising from your use of this website and agree to release us from any liability in connection with your use of, or reliance upon, the content or products found herein.