
|
TCL Technology Group Corporation (000100.SZ) DCF Valuation |
Fully Editable: Tailor To Your Needs In Excel Or Sheets
Professional Design: Trusted, Industry-Standard Templates
Investor-Approved Valuation Models
MAC/PC Compatible, Fully Unlocked
No Expertise Is Needed; Easy To Follow
TCL Technology Group Corporation (000100.SZ) Bundle
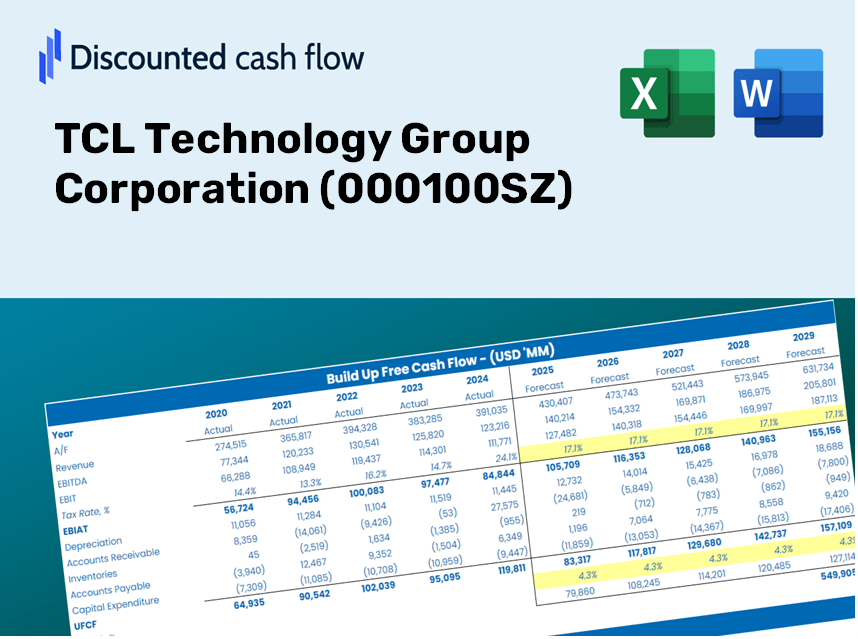
Looking to determine the intrinsic value of TCL Technology Group Corporation? Our (000100SZ) DCF Calculator integrates real-world data with extensive customization features, allowing you to refine your forecasts and enhance your investment strategies.
Discounted Cash Flow (DCF) - (USD MM)
| Year | AY1 2020 |
AY2 2021 |
AY3 2022 |
AY4 2023 |
AY5 2024 |
FY1 2025 |
FY2 2026 |
FY3 2027 |
FY4 2028 |
FY5 2029 |
|---|---|---|---|---|---|---|---|---|---|---|
| Revenue | 76,830.4 | 163,690.6 | 166,632.1 | 174,446.2 | 164,962.8 | 206,636.6 | 258,838.3 | 324,227.4 | 406,135.4 | 508,735.5 |
| Revenue Growth, % | 0 | 113.05 | 1.8 | 4.69 | -5.44 | 25.26 | 25.26 | 25.26 | 25.26 | 25.26 |
| EBITDA | 16,727.0 | 36,522.7 | 25,451.3 | 34,327.5 | 29,053.3 | 39,941.8 | 50,032.1 | 62,671.4 | 78,503.8 | 98,335.9 |
| EBITDA, % | 21.77 | 22.31 | 15.27 | 19.68 | 17.61 | 19.33 | 19.33 | 19.33 | 19.33 | 19.33 |
| Depreciation | 10,545.0 | 17,927.3 | 22,698.5 | 25,589.0 | 27,955.0 | 28,893.6 | 36,192.8 | 45,336.0 | 56,789.0 | 71,135.4 |
| Depreciation, % | 13.73 | 10.95 | 13.62 | 14.67 | 16.95 | 13.98 | 13.98 | 13.98 | 13.98 | 13.98 |
| EBIT | 6,182.0 | 18,595.4 | 2,752.7 | 8,738.5 | 1,098.3 | 11,048.2 | 13,839.3 | 17,335.4 | 21,714.8 | 27,200.5 |
| EBIT, % | 8.05 | 11.36 | 1.65 | 5.01 | 0.66577 | 5.35 | 5.35 | 5.35 | 5.35 | 5.35 |
| Total Cash | 27,009.0 | 38,994.9 | 48,082.0 | 45,108.4 | 39,568.7 | 56,897.8 | 71,271.6 | 89,276.7 | 111,830.2 | 140,081.4 |
| Total Cash, percent | .0 | .0 | .0 | .0 | .0 | .0 | .0 | .0 | .0 | .0 |
| Account Receivables | 15,513.7 | 31,025.4 | 24,432.8 | 29,624.2 | 28,381.7 | 36,366.1 | 45,553.1 | 57,060.9 | 71,476.0 | 89,532.6 |
| Account Receivables, % | 20.19 | 18.95 | 14.66 | 16.98 | 17.2 | 17.6 | 17.6 | 17.6 | 17.6 | 17.6 |
| Inventories | 8,835.0 | 14,083.4 | 18,001.1 | 18,481.8 | 17,594.1 | 21,558.8 | 27,005.1 | 33,827.2 | 42,372.8 | 53,077.3 |
| Inventories, % | 11.5 | 8.6 | 10.8 | 10.59 | 10.67 | 10.43 | 10.43 | 10.43 | 10.43 | 10.43 |
| Accounts Payable | 21,194.5 | 1,380.9 | 32,747.6 | 35,013.3 | 36,455.5 | 37,299.0 | 46,721.7 | 58,524.8 | 73,309.6 | 91,829.5 |
| Accounts Payable, % | 27.59 | 0.8436 | 19.65 | 20.07 | 22.1 | 18.05 | 18.05 | 18.05 | 18.05 | 18.05 |
| Capital Expenditure | -33,085.6 | -30,855.1 | -40,762.8 | -29,574.3 | -23,692.3 | -48,638.5 | -60,925.9 | -76,317.3 | -95,596.9 | -119,747.2 |
| Capital Expenditure, % | -43.06 | -18.85 | -24.46 | -16.95 | -14.36 | -23.54 | -23.54 | -23.54 | -23.54 | -23.54 |
| Tax Rate, % | 139.56 | 139.56 | 139.56 | 139.56 | 139.56 | 139.56 | 139.56 | 139.56 | 139.56 | 139.56 |
| EBITAT | 4,729.9 | 15,837.3 | 4,656.4 | 3,831.3 | -434.5 | 6,751.0 | 8,456.4 | 10,592.8 | 13,268.8 | 16,620.8 |
| Depreciation | ||||||||||
| Changes in Account Receivables | ||||||||||
| Changes in Inventories | ||||||||||
| Changes in Accounts Payable | ||||||||||
| Capital Expenditure | ||||||||||
| UFCF | -20,964.7 | -37,664.2 | 20,633.6 | -3,560.3 | 7,400.6 | -24,099.5 | -21,487.2 | -26,915.4 | -33,715.0 | -42,232.2 |
| WACC, % | 4.68 | 4.87 | 5.21 | 3.93 | 2.93 | 4.32 | 4.32 | 4.32 | 4.32 | 4.32 |
| PV UFCF | ||||||||||
| SUM PV UFCF | -129,190.5 | |||||||||
| Long Term Growth Rate, % | 2.00 | |||||||||
| Free cash flow (T + 1) | -43,077 | |||||||||
| Terminal Value | -1,853,968 | |||||||||
| Present Terminal Value | -1,500,346 | |||||||||
| Enterprise Value | -1,629,537 | |||||||||
| Net Debt | 115,425 | |||||||||
| Equity Value | -1,744,962 | |||||||||
| Diluted Shares Outstanding, MM | 18,777 | |||||||||
| Equity Value Per Share | -92.93 |
What You Will Receive
- Accurate TCL Financial Data: Pre-filled with historical and projected figures for precise analysis of TCL Technology Group Corporation (000100SZ).
- Customizable Template: Easily adjust essential inputs such as revenue growth, WACC, and EBITDA percentage.
- Instant Calculations: Observe real-time updates to TCL's intrinsic value based on your modifications.
- Professional Valuation Tool: Tailored for investors, analysts, and consultants aiming for reliable DCF results.
- User-Friendly Interface: Intuitive layout and straightforward instructions for users of all expertise levels.
Key Features
- 🔍 Real-Life TCL Financials: Pre-filled historical and projected data for TCL Technology Group Corporation (000100SZ).
- ✏️ Fully Customizable Inputs: Modify all essential parameters (yellow cells) such as WACC, growth %, and tax rates.
- 📊 Professional DCF Valuation: Integrated formulas compute TCL's intrinsic value using the Discounted Cash Flow method.
- ⚡ Instant Results: See TCL’s valuation immediately after making adjustments.
- Scenario Analysis: Explore and compare outcomes based on different financial assumptions side-by-side.
How It Functions
- Download the Template: Gain immediate access to the Excel-based TCL DCF Calculator.
- Input Your Assumptions: Modify the yellow-highlighted cells for growth rates, WACC, margins, and other key variables.
- Instant Calculations: The model automatically revises TCL Technology Group's intrinsic value.
- Test Scenarios: Experiment with various assumptions to assess potential changes in valuation.
- Analyze and Decide: Utilize the outcomes to inform your investment or financial evaluation.
Reasons to Choose TCL's Calculator
- Precision: Utilizes authentic TCL financials to guarantee data reliability.
- Versatility: Built for users to easily experiment with and adjust variables.
- Efficiency: Eliminate the need to create a DCF model from the ground up.
- Expert-Level: Crafted with the accuracy and functionality expected at the CFO level.
- Intuitive: Simple to navigate, even for those lacking advanced financial modeling skills.
Who Should Use This Product?
- Professional Investors: Create comprehensive and accurate valuation models for in-depth portfolio assessments.
- Corporate Finance Teams: Evaluate valuation scenarios to inform strategic decisions within the company.
- Consultants and Advisors: Deliver precise valuation insights to clients focusing on TCL Technology Group Corporation (000100SZ).
- Students and Educators: Leverage real-world data to enhance financial modeling skills in academic settings.
- Tech Enthusiasts: Gain insights into the valuation processes of technology companies like TCL in the marketplace.
What the Template Contains
- Historical Data: Provides TCL Technology Group Corporation's past financials and baseline forecasts.
- DCF and Levered DCF Models: Comprehensive templates to determine the intrinsic value of TCL Technology Group Corporation (000100SZ).
- WACC Sheet: Ready-made calculations for the Weighted Average Cost of Capital.
- Editable Inputs: Adjust key drivers such as growth rates, EBITDA %, and CAPEX assumptions.
- Quarterly and Annual Statements: A thorough overview of TCL Technology Group Corporation's financials.
- Interactive Dashboard: Dynamically visualize valuation results and future projections.
Disclaimer
All information, articles, and product details provided on this website are for general informational and educational purposes only. We do not claim any ownership over, nor do we intend to infringe upon, any trademarks, copyrights, logos, brand names, or other intellectual property mentioned or depicted on this site. Such intellectual property remains the property of its respective owners, and any references here are made solely for identification or informational purposes, without implying any affiliation, endorsement, or partnership.
We make no representations or warranties, express or implied, regarding the accuracy, completeness, or suitability of any content or products presented. Nothing on this website should be construed as legal, tax, investment, financial, medical, or other professional advice. In addition, no part of this site—including articles or product references—constitutes a solicitation, recommendation, endorsement, advertisement, or offer to buy or sell any securities, franchises, or other financial instruments, particularly in jurisdictions where such activity would be unlawful.
All content is of a general nature and may not address the specific circumstances of any individual or entity. It is not a substitute for professional advice or services. Any actions you take based on the information provided here are strictly at your own risk. You accept full responsibility for any decisions or outcomes arising from your use of this website and agree to release us from any liability in connection with your use of, or reliance upon, the content or products found herein.