
|
China National Complete Plant Import & Export Corporation Limited (000151.SZ) DCF Valuation |
Fully Editable: Tailor To Your Needs In Excel Or Sheets
Professional Design: Trusted, Industry-Standard Templates
Investor-Approved Valuation Models
MAC/PC Compatible, Fully Unlocked
No Expertise Is Needed; Easy To Follow
China National Complete Plant Import & Export Corporation Limited (000151.SZ) Bundle
Discover the true value of China National Complete Plant Import & Export Corporation Limited (000151SZ) with our advanced DCF Calculator! Adjust key assumptions, explore various scenarios, and examine how different factors influence the valuation of China National Complete Plant Import & Export Corporation Limited (000151SZ) – all within a user-friendly Excel template.
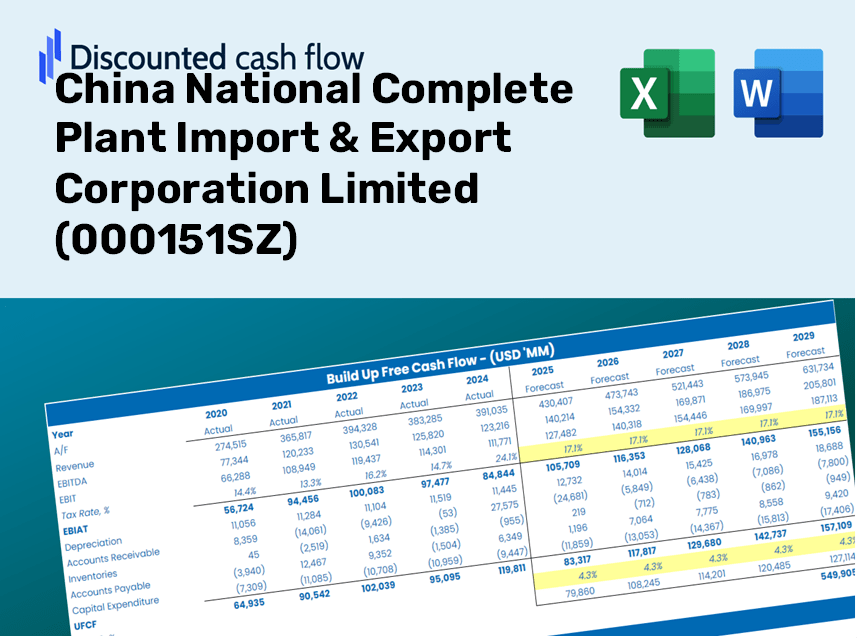
Discounted Cash Flow (DCF) - (USD MM)
| Year | AY1 2020 |
AY2 2021 |
AY3 2022 |
AY4 2023 |
AY5 2024 |
FY1 2025 |
FY2 2026 |
FY3 2027 |
FY4 2028 |
FY5 2029 |
|---|---|---|---|---|---|---|---|---|---|---|
| Revenue | 780.8 | 2,159.6 | 4,222.0 | 3,067.3 | 1,226.3 | 1,557.9 | 1,979.0 | 2,514.0 | 3,193.5 | 4,056.8 |
| Revenue Growth, % | 0 | 176.57 | 95.5 | -27.35 | -60.02 | 27.03 | 27.03 | 27.03 | 27.03 | 27.03 |
| EBITDA | -181.5 | 138.9 | -449.3 | -372.6 | -465.8 | -241.7 | -307.1 | -390.1 | -495.5 | -629.5 |
| EBITDA, % | -23.25 | 6.43 | -10.64 | -12.15 | -37.98 | -15.52 | -15.52 | -15.52 | -15.52 | -15.52 |
| Depreciation | 21.7 | 27.0 | 32.0 | 29.6 | 29.6 | 25.4 | 32.3 | 41.0 | 52.1 | 66.2 |
| Depreciation, % | 2.78 | 1.25 | 0.75727 | 0.964 | 2.42 | 1.63 | 1.63 | 1.63 | 1.63 | 1.63 |
| EBIT | -203.2 | 111.9 | -481.3 | -402.2 | -495.4 | -267.2 | -339.4 | -431.1 | -547.7 | -695.8 |
| EBIT, % | -26.02 | 5.18 | -11.4 | -13.11 | -40.4 | -17.15 | -17.15 | -17.15 | -17.15 | -17.15 |
| Total Cash | 475.0 | 1,120.4 | 1,133.6 | 1,416.5 | 1,159.5 | 873.3 | 1,109.4 | 1,409.3 | 1,790.2 | 2,274.2 |
| Total Cash, percent | .0 | .0 | .0 | .0 | .0 | .0 | .0 | .0 | .0 | .0 |
| Account Receivables | .0 | 985.6 | 1,926.2 | 939.9 | 544.2 | 518.1 | 658.1 | 836.0 | 1,062.0 | 1,349.1 |
| Account Receivables, % | 0 | 45.64 | 45.62 | 30.64 | 44.38 | 33.26 | 33.26 | 33.26 | 33.26 | 33.26 |
| Inventories | 299.5 | 352.0 | 140.3 | 127.8 | 124.7 | 225.3 | 286.2 | 363.6 | 461.9 | 586.7 |
| Inventories, % | 38.36 | 16.3 | 3.32 | 4.17 | 10.17 | 14.46 | 14.46 | 14.46 | 14.46 | 14.46 |
| Accounts Payable | 558.9 | 633.3 | 1,322.4 | 925.6 | 814.8 | 713.0 | 905.8 | 1,150.6 | 1,461.6 | 1,856.8 |
| Accounts Payable, % | 71.58 | 29.32 | 31.32 | 30.18 | 66.44 | 45.77 | 45.77 | 45.77 | 45.77 | 45.77 |
| Capital Expenditure | -.6 | -10.9 | -8.3 | -24.9 | -3.4 | -5.8 | -7.4 | -9.4 | -12.0 | -15.2 |
| Capital Expenditure, % | -0.08012674 | -0.50623 | -0.19705 | -0.8131 | -0.2806 | -0.37542 | -0.37542 | -0.37542 | -0.37542 | -0.37542 |
| Tax Rate, % | 42.83 | 42.83 | 42.83 | 42.83 | 42.83 | 42.83 | 42.83 | 42.83 | 42.83 | 42.83 |
| EBITAT | -199.6 | 85.4 | -435.5 | -229.8 | -283.2 | -202.7 | -257.5 | -327.1 | -415.5 | -527.9 |
| Depreciation | ||||||||||
| Changes in Account Receivables | ||||||||||
| Changes in Inventories | ||||||||||
| Changes in Accounts Payable | ||||||||||
| Capital Expenditure | ||||||||||
| UFCF | 80.9 | -862.3 | -451.6 | 376.9 | 30.9 | -359.4 | -240.8 | -305.9 | -388.6 | -493.7 |
| WACC, % | 7.75 | 7.55 | 7.68 | 7.38 | 7.38 | 7.55 | 7.55 | 7.55 | 7.55 | 7.55 |
| PV UFCF | ||||||||||
| SUM PV UFCF | -1,421.9 | |||||||||
| Long Term Growth Rate, % | 4.00 | |||||||||
| Free cash flow (T + 1) | -513 | |||||||||
| Terminal Value | -14,472 | |||||||||
| Present Terminal Value | -10,058 | |||||||||
| Enterprise Value | -11,480 | |||||||||
| Net Debt | -538 | |||||||||
| Equity Value | -10,941 | |||||||||
| Diluted Shares Outstanding, MM | 337 | |||||||||
| Equity Value Per Share | -32.43 |
What You Will Receive
- Genuine CNP Financials: Access to both historical and projected data for precise valuation.
- Customizable Inputs: Adjust key variables such as WACC, tax rates, revenue growth, and capital expenditures.
- Automated Calculations: Dynamic computation of intrinsic value and NPV.
- Scenario Testing: Explore multiple scenarios to assess CNP’s potential future performance.
- User-Friendly Design: Crafted for industry professionals while remaining accessible for newcomers.
Key Features
- Pre-Loaded Data: Historical financial statements and pre-filled forecasts for China National Complete Plant Import & Export Corporation Limited (000151SZ).
- Fully Adjustable Inputs: Customize WACC, tax rates, revenue growth, and EBITDA margins to fit your analysis.
- Instant Results: View the intrinsic value of China National Complete Plant Import & Export Corporation Limited (000151SZ) recalculating in real time.
- Clear Visual Outputs: Dashboard charts provide visual representation of valuation results and key metrics.
- Built for Accuracy: A professional-grade tool tailored for analysts, investors, and finance professionals.
How It Functions
- Step 1: Download the pre-built Excel template containing data for China National Complete Plant Import & Export Corporation Limited (000151SZ).
- Step 2: Review the pre-filled sheets to familiarize yourself with the key performance indicators.
- Step 3: Adjust forecasts and assumptions in the editable yellow cells (WACC, growth, margins).
- Step 4: Instantly see updated results, including the intrinsic value of China National Complete Plant Import & Export Corporation Limited (000151SZ).
- Step 5: Make well-informed investment decisions or create reports based on the outputs.
Why Choose Our Services?
- Precision: Leveraging authentic financial data for enhanced accuracy.
- Versatility: Tailored for users to experiment and adjust inputs as needed.
- Efficiency: Eliminate the complexity of starting from scratch with your models.
- Expert-Level: Crafted with the meticulousness and functionality of top financial professionals.
- Intuitive: Simple to navigate, even for those new to financial analysis.
Who Would Benefit from This Product?
- Investors: Effectively gauge the fair value of China National Complete Plant Import & Export Corporation Limited (000151SZ) before making investment choices.
- CFOs: Utilize a high-quality DCF model for accurate financial reporting and analysis.
- Consultants: Efficiently customize the template for client valuation reports.
- Entrepreneurs: Discover financial modeling techniques employed by leading companies.
- Educators: Implement it as a resource for teaching valuation concepts and methodologies.
Contents of the Template
- Pre-Filled DCF Model: Financial data for China National Complete Plant Import & Export Corporation Limited (000151SZ) ready for immediate analysis.
- WACC Calculator: Comprehensive calculations for the Weighted Average Cost of Capital.
- Financial Ratios: Assess profitability, leverage, and efficiency for China National Complete Plant Import & Export Corporation Limited (000151SZ).
- Editable Inputs: Adjust assumptions such as growth rates, margins, and CAPEX to align with your scenarios.
- Financial Statements: Access annual and quarterly reports for in-depth analysis.
- Interactive Dashboard: Effortlessly visualize key valuation metrics and outcomes.
Disclaimer
All information, articles, and product details provided on this website are for general informational and educational purposes only. We do not claim any ownership over, nor do we intend to infringe upon, any trademarks, copyrights, logos, brand names, or other intellectual property mentioned or depicted on this site. Such intellectual property remains the property of its respective owners, and any references here are made solely for identification or informational purposes, without implying any affiliation, endorsement, or partnership.
We make no representations or warranties, express or implied, regarding the accuracy, completeness, or suitability of any content or products presented. Nothing on this website should be construed as legal, tax, investment, financial, medical, or other professional advice. In addition, no part of this site—including articles or product references—constitutes a solicitation, recommendation, endorsement, advertisement, or offer to buy or sell any securities, franchises, or other financial instruments, particularly in jurisdictions where such activity would be unlawful.
All content is of a general nature and may not address the specific circumstances of any individual or entity. It is not a substitute for professional advice or services. Any actions you take based on the information provided here are strictly at your own risk. You accept full responsibility for any decisions or outcomes arising from your use of this website and agree to release us from any liability in connection with your use of, or reliance upon, the content or products found herein.