
|
Shijiazhuang ChangShan BeiMing Technology Co.,Ltd (000158.SZ) DCF Valuation |
Fully Editable: Tailor To Your Needs In Excel Or Sheets
Professional Design: Trusted, Industry-Standard Templates
Investor-Approved Valuation Models
MAC/PC Compatible, Fully Unlocked
No Expertise Is Needed; Easy To Follow
Shijiazhuang ChangShan BeiMing Technology Co.,Ltd (000158.SZ) Bundle
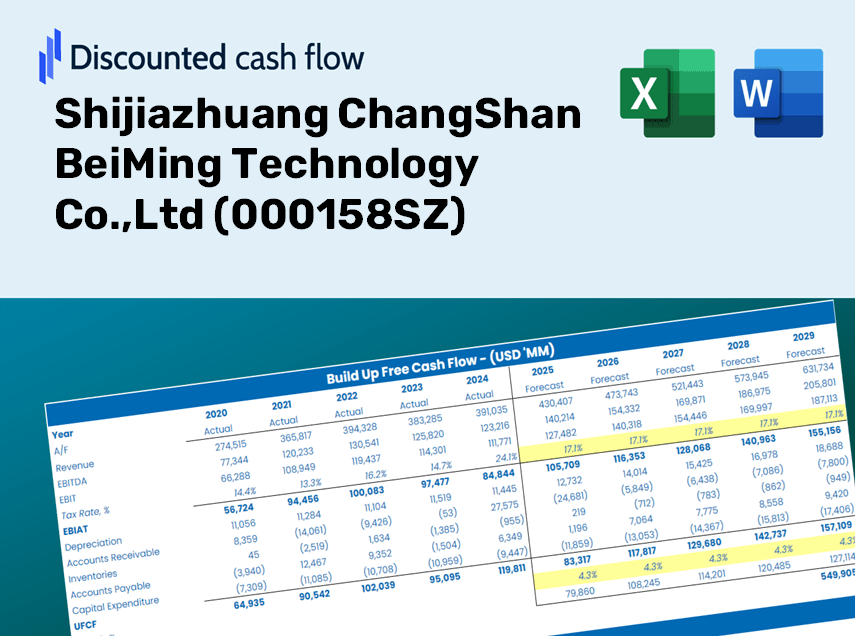
Looking to assess the intrinsic value of Shijiazhuang ChangShan BeiMing Technology Co., Ltd? Our (000158SZ) DCF Calculator integrates real-world data with extensive customization features, enabling you to refine your forecasts and enhance your investment choices.
Discounted Cash Flow (DCF) - (USD MM)
| Year | AY1 2020 |
AY2 2021 |
AY3 2022 |
AY4 2023 |
AY5 2024 |
FY1 2025 |
FY2 2026 |
FY3 2027 |
FY4 2028 |
FY5 2029 |
|---|---|---|---|---|---|---|---|---|---|---|
| Revenue | 9,883.8 | 10,881.6 | 9,663.5 | 9,007.2 | 8,818.3 | 8,598.2 | 8,383.5 | 8,174.2 | 7,970.1 | 7,771.1 |
| Revenue Growth, % | 0 | 10.1 | -11.19 | -6.79 | -2.1 | -2.5 | -2.5 | -2.5 | -2.5 | -2.5 |
| EBITDA | 640.4 | 682.5 | 340.1 | 448.8 | 17.1 | 368.8 | 359.6 | 350.6 | 341.9 | 333.3 |
| EBITDA, % | 6.48 | 6.27 | 3.52 | 4.98 | 0.19337 | 4.29 | 4.29 | 4.29 | 4.29 | 4.29 |
| Depreciation | 249.5 | 287.4 | 323.0 | 367.3 | 366.3 | 287.9 | 280.7 | 273.7 | 266.8 | 260.2 |
| Depreciation, % | 2.52 | 2.64 | 3.34 | 4.08 | 4.15 | 3.35 | 3.35 | 3.35 | 3.35 | 3.35 |
| EBIT | 390.9 | 395.2 | 17.1 | 81.5 | -349.3 | 80.9 | 78.9 | 77.0 | 75.0 | 73.2 |
| EBIT, % | 3.96 | 3.63 | 0.17654 | 0.90439 | -3.96 | 0.94145 | 0.94145 | 0.94145 | 0.94145 | 0.94145 |
| Total Cash | 2,338.7 | 2,361.3 | 2,422.8 | 3,524.1 | 2,182.6 | 2,309.6 | 2,252.0 | 2,195.7 | 2,140.9 | 2,087.4 |
| Total Cash, percent | .0 | .0 | .0 | .0 | .0 | .0 | .0 | .0 | .0 | .0 |
| Account Receivables | 2,883.9 | 3,376.2 | 3,533.2 | 3,876.6 | 5,749.5 | 3,525.4 | 3,437.3 | 3,351.5 | 3,267.8 | 3,186.2 |
| Account Receivables, % | 29.18 | 31.03 | 36.56 | 43.04 | 65.2 | 41 | 41 | 41 | 41 | 41 |
| Inventories | 2,417.0 | 3,010.3 | 2,938.8 | 2,845.3 | 2,022.7 | 2,356.9 | 2,298.0 | 2,240.6 | 2,184.7 | 2,130.1 |
| Inventories, % | 24.45 | 27.66 | 30.41 | 31.59 | 22.94 | 27.41 | 27.41 | 27.41 | 27.41 | 27.41 |
| Accounts Payable | 1,889.7 | 3,700.0 | 3,893.2 | 2,793.4 | 3,071.9 | 2,738.7 | 2,670.3 | 2,603.6 | 2,538.6 | 2,475.2 |
| Accounts Payable, % | 19.12 | 34 | 40.29 | 31.01 | 34.84 | 31.85 | 31.85 | 31.85 | 31.85 | 31.85 |
| Capital Expenditure | -306.0 | -292.2 | -283.0 | -174.3 | -295.3 | -240.6 | -234.6 | -228.8 | -223.1 | -217.5 |
| Capital Expenditure, % | -3.1 | -2.68 | -2.93 | -1.94 | -3.35 | -2.8 | -2.8 | -2.8 | -2.8 | -2.8 |
| Tax Rate, % | 8.26 | 8.26 | 8.26 | 8.26 | 8.26 | 8.26 | 8.26 | 8.26 | 8.26 | 8.26 |
| EBITAT | 323.3 | 372.3 | 16.3 | 58.0 | -320.4 | 70.5 | 68.7 | 67.0 | 65.3 | 63.7 |
| Depreciation | ||||||||||
| Changes in Account Receivables | ||||||||||
| Changes in Inventories | ||||||||||
| Changes in Accounts Payable | ||||||||||
| Capital Expenditure | ||||||||||
| UFCF | -3,144.5 | 1,092.2 | 164.1 | -1,098.8 | -1,021.2 | 1,674.5 | 193.3 | 188.4 | 183.7 | 179.1 |
| WACC, % | 4.77 | 4.86 | 4.87 | 4.68 | 4.84 | 4.8 | 4.8 | 4.8 | 4.8 | 4.8 |
| PV UFCF | ||||||||||
| SUM PV UFCF | 2,231.3 | |||||||||
| Long Term Growth Rate, % | 4.00 | |||||||||
| Free cash flow (T + 1) | 186 | |||||||||
| Terminal Value | 23,184 | |||||||||
| Present Terminal Value | 18,336 | |||||||||
| Enterprise Value | 20,567 | |||||||||
| Net Debt | 2,687 | |||||||||
| Equity Value | 17,880 | |||||||||
| Diluted Shares Outstanding, MM | 1,604 | |||||||||
| Equity Value Per Share | 11.15 |
What You Will Receive
- Authentic Shijiazhuang Data: Preloaded financials – encompassing revenue to EBIT – based on actual and forecasted figures.
- Comprehensive Customization: Modify all essential parameters (yellow cells) such as WACC, growth %, and tax rates.
- Real-Time Valuation Adjustments: Automatic recalculations to assess the influence of changes on the fair value of Shijiazhuang ChangShan BeiMing Technology Co.,Ltd (000158SZ).
- Flexible Excel Template: Designed for quick modifications, scenario analysis, and in-depth projections.
- Efficient and Accurate: Bypass the need to build models from the ground up while ensuring precision and adaptability.
Key Features
- Customizable Forecast Inputs: Adjust essential metrics such as revenue growth, EBITDA %, and capital expenditures.
- Instant DCF Valuation: Automatically computes intrinsic value, NPV, and additional financial metrics in real-time.
- Top-Notch Accuracy: Utilizes the actual financial data of Shijiazhuang ChangShan BeiMing Technology Co., Ltd (000158SZ) for credible valuation results.
- Streamlined Scenario Analysis: Effortlessly evaluate various assumptions and analyze the resulting outcomes.
- Time-Efficient Solution: Avoid the complexities of building valuation models from scratch.
How It Works
- Download: Obtain the pre-formatted Excel file containing Shijiazhuang ChangShan BeiMing Technology Co., Ltd's (000158SZ) financial data.
- Customize: Modify forecasts, such as revenue growth rates, EBITDA percentages, and WACC values.
- Update Automatically: Watch as intrinsic value and NPV calculations refresh in real-time.
- Test Scenarios: Develop various projections and instantly analyze the outcomes.
- Make Decisions: Leverage the valuation results to inform your investment approach.
Why Select Our Financial Calculator?
- All-in-One Solution: Features DCF, WACC, and comprehensive financial ratio analyses seamlessly integrated.
- Flexible Configurations: Modify the highlighted cells to explore different financial scenarios.
- In-Depth Analysis: Automatically computes the intrinsic value and Net Present Value for Shijiazhuang ChangShan BeiMing Technology Co.,Ltd (000158SZ).
- Ready-to-Use Data: Comes with both historical and projected data for precise calculations.
- High-Quality Standards: Perfect for financial analysts, investors, and business consultants seeking reliable insights.
Who Can Benefit from This Product?
- Investors: Evaluate the valuation of Shijiazhuang ChangShan BeiMing Technology Co., Ltd (000158SZ) prior to making trading decisions.
- CFOs and Financial Analysts: Optimize the valuation process and assess financial forecasts for accuracy.
- Startup Founders: Gain insights into how established companies like Shijiazhuang ChangShan BeiMing Technology Co., Ltd (000158SZ) determine their market value.
- Consultants: Produce comprehensive valuation reports for your clients based on reliable data.
- Students and Educators: Utilize current market data to practice and illustrate valuation methodologies.
Contents of the Template
- Operating and Balance Sheet Data: Pre-filled historical data and forecasts for Shijiazhuang ChangShan BeiMing Technology Co.,Ltd (000158SZ), including revenue, EBITDA, EBIT, and capital expenditures.
- WACC Calculation: A dedicated sheet for the Weighted Average Cost of Capital (WACC), featuring key parameters such as Beta, risk-free rate, and stock price.
- DCF Valuation (Unlevered and Levered): Editable Discounted Cash Flow models that provide intrinsic value along with detailed calculations.
- Financial Statements: Pre-loaded annual and quarterly financial statements to facilitate thorough analysis.
- Key Ratios: Comprehensive metrics including profitability, leverage, and efficiency ratios for Shijiazhuang ChangShan BeiMing Technology Co.,Ltd (000158SZ).
- Dashboard and Charts: A visual summary of valuation outputs and assumptions to simplify result analysis.
Disclaimer
All information, articles, and product details provided on this website are for general informational and educational purposes only. We do not claim any ownership over, nor do we intend to infringe upon, any trademarks, copyrights, logos, brand names, or other intellectual property mentioned or depicted on this site. Such intellectual property remains the property of its respective owners, and any references here are made solely for identification or informational purposes, without implying any affiliation, endorsement, or partnership.
We make no representations or warranties, express or implied, regarding the accuracy, completeness, or suitability of any content or products presented. Nothing on this website should be construed as legal, tax, investment, financial, medical, or other professional advice. In addition, no part of this site—including articles or product references—constitutes a solicitation, recommendation, endorsement, advertisement, or offer to buy or sell any securities, franchises, or other financial instruments, particularly in jurisdictions where such activity would be unlawful.
All content is of a general nature and may not address the specific circumstances of any individual or entity. It is not a substitute for professional advice or services. Any actions you take based on the information provided here are strictly at your own risk. You accept full responsibility for any decisions or outcomes arising from your use of this website and agree to release us from any liability in connection with your use of, or reliance upon, the content or products found herein.