
|
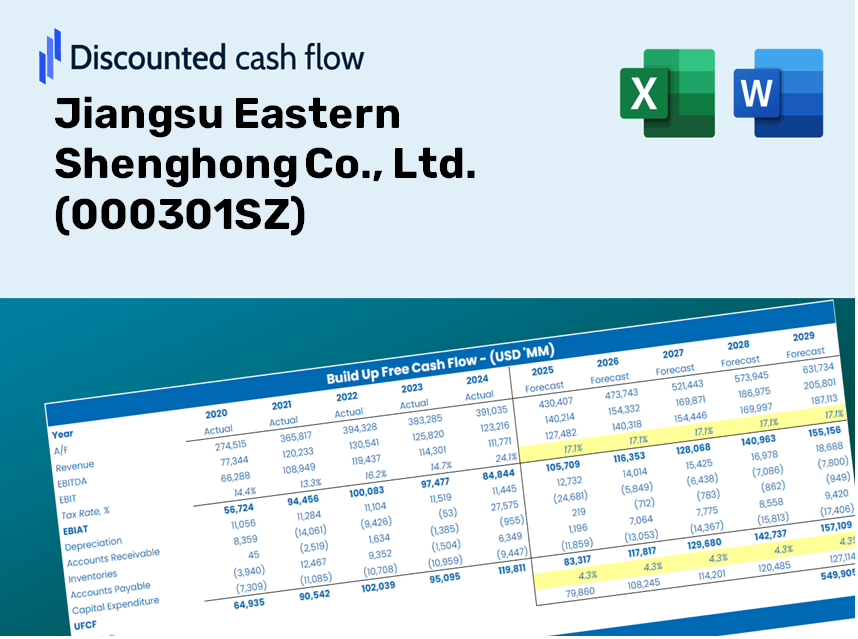
Jiangsu Eastern Shenghong Co., Ltd. (000301.SZ) DCF Valuation |
Fully Editable: Tailor To Your Needs In Excel Or Sheets
Professional Design: Trusted, Industry-Standard Templates
Investor-Approved Valuation Models
MAC/PC Compatible, Fully Unlocked
No Expertise Is Needed; Easy To Follow
Jiangsu Eastern Shenghong Co., Ltd. (000301.SZ) Bundle
Enhance your investment strategies with the (000301SZ) DCF Calculator! Utilize genuine financial data from Jiangsu Eastern Shenghong Co., Ltd., adjust growth projections and expenses, and immediately observe how those changes affect the intrinsic value of (000301SZ).
Discounted Cash Flow (DCF) - (USD MM)
| Year | AY1 2020 |
AY2 2021 |
AY3 2022 |
AY4 2023 |
AY5 2024 |
FY1 2025 |
FY2 2026 |
FY3 2027 |
FY4 2028 |
FY5 2029 |
|---|---|---|---|---|---|---|---|---|---|---|
| Revenue | 33,698.8 | 52,690.2 | 63,872.9 | 140,439.7 | 137,674.6 | 198,117.4 | 285,096.4 | 410,261.4 | 590,377.4 | 849,569.1 |
| Revenue Growth, % | 0 | 56.36 | 21.22 | 119.87 | -1.97 | 43.9 | 43.9 | 43.9 | 43.9 | 43.9 |
| EBITDA | 3,597.7 | 9,150.7 | 4,436.1 | 8,125.9 | 7,777.1 | 18,394.5 | 26,470.1 | 38,091.2 | 54,814.3 | 78,879.3 |
| EBITDA, % | 10.68 | 17.37 | 6.95 | 5.79 | 5.65 | 9.28 | 9.28 | 9.28 | 9.28 | 9.28 |
| Depreciation | 1,911.8 | 2,108.7 | 2,505.9 | 4,817.4 | 7,119.0 | 8,796.2 | 12,658.0 | 18,215.2 | 26,212.2 | 37,720.1 |
| Depreciation, % | 5.67 | 4 | 3.92 | 3.43 | 5.17 | 4.44 | 4.44 | 4.44 | 4.44 | 4.44 |
| EBIT | 1,685.9 | 7,042.0 | 1,930.2 | 3,308.5 | 658.1 | 9,598.2 | 13,812.1 | 19,876.0 | 28,602.1 | 41,159.2 |
| EBIT, % | 5 | 13.36 | 3.02 | 2.36 | 0.47803 | 4.84 | 4.84 | 4.84 | 4.84 | 4.84 |
| Total Cash | 15,668.6 | 13,540.2 | 12,327.4 | 10,094.6 | 13,743.0 | 43,056.4 | 61,959.3 | 89,161.1 | 128,305.2 | 184,634.7 |
| Total Cash, percent | .0 | .0 | .0 | .0 | .0 | .0 | .0 | .0 | .0 | .0 |
| Account Receivables | 6,624.7 | 957.7 | 915.1 | 2,823.5 | 3,971.0 | 11,016.9 | 15,853.6 | 22,813.7 | 32,829.5 | 47,242.6 |
| Account Receivables, % | 19.66 | 1.82 | 1.43 | 2.01 | 2.88 | 5.56 | 5.56 | 5.56 | 5.56 | 5.56 |
| Inventories | 2,728.7 | 6,086.0 | 17,533.1 | 18,208.2 | 16,873.2 | 28,655.2 | 41,235.6 | 59,339.1 | 85,390.6 | 122,879.4 |
| Inventories, % | 8.1 | 11.55 | 27.45 | 12.97 | 12.26 | 14.46 | 14.46 | 14.46 | 14.46 | 14.46 |
| Accounts Payable | 7,838.5 | 18,489.2 | 10,689.2 | 15,950.7 | 14,250.8 | 38,353.4 | 55,191.6 | 79,422.2 | 114,290.7 | 164,467.4 |
| Accounts Payable, % | 23.26 | 35.09 | 16.74 | 11.36 | 10.35 | 19.36 | 19.36 | 19.36 | 19.36 | 19.36 |
| Capital Expenditure | -16,784.1 | -41,717.4 | -31,365.7 | -23,767.5 | -12,700.9 | -80,925.5 | -116,454.1 | -167,580.6 | -241,153.0 | -347,025.7 |
| Capital Expenditure, % | -49.81 | -79.17 | -49.11 | -16.92 | -9.23 | -40.85 | -40.85 | -40.85 | -40.85 | -40.85 |
| Tax Rate, % | 38.15 | 38.15 | 38.15 | 38.15 | 38.15 | 38.15 | 38.15 | 38.15 | 38.15 | 38.15 |
| EBITAT | 1,156.7 | 5,290.0 | 2,217.7 | 7,628.7 | 407.0 | 7,785.6 | 11,203.7 | 16,122.5 | 23,200.7 | 33,386.4 |
| Depreciation | ||||||||||
| Changes in Account Receivables | ||||||||||
| Changes in Inventories | ||||||||||
| Changes in Accounts Payable | ||||||||||
| Capital Expenditure | ||||||||||
| UFCF | -15,230.6 | -21,358.3 | -45,846.6 | -8,643.4 | -6,687.2 | -59,068.9 | -93,171.2 | -134,075.9 | -192,938.9 | -277,644.3 |
| WACC, % | 4.68 | 4.87 | 5.57 | 5.57 | 4.49 | 5.04 | 5.04 | 5.04 | 5.04 | 5.04 |
| PV UFCF | ||||||||||
| SUM PV UFCF | -632,062.3 | |||||||||
| Long Term Growth Rate, % | 4.00 | |||||||||
| Free cash flow (T + 1) | -288,750 | |||||||||
| Terminal Value | -27,860,235 | |||||||||
| Present Terminal Value | -21,791,401 | |||||||||
| Enterprise Value | -22,423,463 | |||||||||
| Net Debt | 107,484 | |||||||||
| Equity Value | -22,530,947 | |||||||||
| Diluted Shares Outstanding, MM | 6,562 | |||||||||
| Equity Value Per Share | -3,433.34 |
Benefits of Choosing Jiangsu Eastern Shenghong Co., Ltd. (000301SZ)
- Authentic Financial Data: Preloaded financial metrics – from revenue to EBIT – based on real and projected values.
- Comprehensive Customization: Modify essential parameters (yellow cells) such as WACC, growth %, and tax rates.
- Immediate Valuation Adjustments: Automatic recalculations to assess the effects of changes on the fair value of Jiangsu Eastern Shenghong Co., Ltd. (000301SZ).
- Flexible Excel Template: Designed for quick modifications, scenario analysis, and in-depth forecasts.
- Efficient and Precise: Avoid the hassle of building models from the ground up while ensuring accuracy and adaptability.
Key Features
- Comprehensive Historical Data: Pre-loaded with Jiangsu Eastern Shenghong Co., Ltd.’s (000301SZ) past financial performance and future forecasts.
- Customizable Parameters: Tailor inputs for revenue growth, profit margins, WACC, tax rates, and capital expenditures.
- Interactive Valuation Tool: Automatically recalculates Net Present Value (NPV) and intrinsic value based on user-defined inputs.
- Scenario Analysis: Develop various forecasting scenarios to evaluate different valuation possibilities.
- Intuitive Interface: Designed for ease of use, catering to both experienced professionals and newcomers.
How It Functions
- Step 1: Download the Excel spreadsheet.
- Step 2: Examine the pre-filled financial data and forecasts for Jiangsu Eastern Shenghong Co., Ltd. (000301SZ).
- Step 3: Adjust key inputs such as revenue growth, WACC, and tax rates (highlighted cells).
- Step 4: Observe the DCF model update in real-time as you modify your assumptions.
- Step 5: Review the outputs and utilize the findings for your investment strategies.
Why Opt for Jiangsu Eastern Shenghong Co., Ltd. (000301SZ) Calculator?
- Designed for Experts: A sophisticated tool utilized by financial analysts, CFOs, and consultants.
- Comprehensive Data: Historical and projected financial information for Jiangsu Eastern Shenghong preloaded for precision.
- Flexible Scenario Analysis: Effortlessly model various forecasts and assumptions.
- Transparent Results: Automatically computes intrinsic value, NPV, and essential metrics.
- User-Friendly Interface: Clear, step-by-step guidance makes navigation simple.
Who Can Benefit from This Product?
- Individual Investors: Make informed choices regarding the purchase or sale of Jiangsu Eastern Shenghong Co., Ltd. (000301SZ) stock.
- Financial Analysts: Enhance valuation workflows with pre-built financial models tailored for Jiangsu Eastern Shenghong Co., Ltd. (000301SZ).
- Consultants: Provide precise and timely valuation insights for clients, focusing on Jiangsu Eastern Shenghong Co., Ltd. (000301SZ).
- Business Owners: Gain insight into how major firms like Jiangsu Eastern Shenghong Co., Ltd. (000301SZ) are valued to refine your own business strategy.
- Finance Students: Explore valuation methodologies using real-life data and case studies related to Jiangsu Eastern Shenghong Co., Ltd. (000301SZ).
Contents of the Template
- Preloaded JSH Data: Historical and projected financial figures, encompassing revenue, EBIT, and capital expenditures.
- DCF and WACC Models: Professional-grade templates for assessing intrinsic value and Weighted Average Cost of Capital.
- Edit-Friendly Inputs: Yellow-highlighted cells for modifying revenue growth, tax rates, and discount rates.
- Financial Statements: Detailed annual and quarterly financial statements for thorough analysis.
- Key Ratios: Metrics for profitability, leverage, and efficiency to assess performance.
- Dashboard and Charts: Visual representations of valuation results and underlying assumptions.
Disclaimer
All information, articles, and product details provided on this website are for general informational and educational purposes only. We do not claim any ownership over, nor do we intend to infringe upon, any trademarks, copyrights, logos, brand names, or other intellectual property mentioned or depicted on this site. Such intellectual property remains the property of its respective owners, and any references here are made solely for identification or informational purposes, without implying any affiliation, endorsement, or partnership.
We make no representations or warranties, express or implied, regarding the accuracy, completeness, or suitability of any content or products presented. Nothing on this website should be construed as legal, tax, investment, financial, medical, or other professional advice. In addition, no part of this site—including articles or product references—constitutes a solicitation, recommendation, endorsement, advertisement, or offer to buy or sell any securities, franchises, or other financial instruments, particularly in jurisdictions where such activity would be unlawful.
All content is of a general nature and may not address the specific circumstances of any individual or entity. It is not a substitute for professional advice or services. Any actions you take based on the information provided here are strictly at your own risk. You accept full responsibility for any decisions or outcomes arising from your use of this website and agree to release us from any liability in connection with your use of, or reliance upon, the content or products found herein.