
|
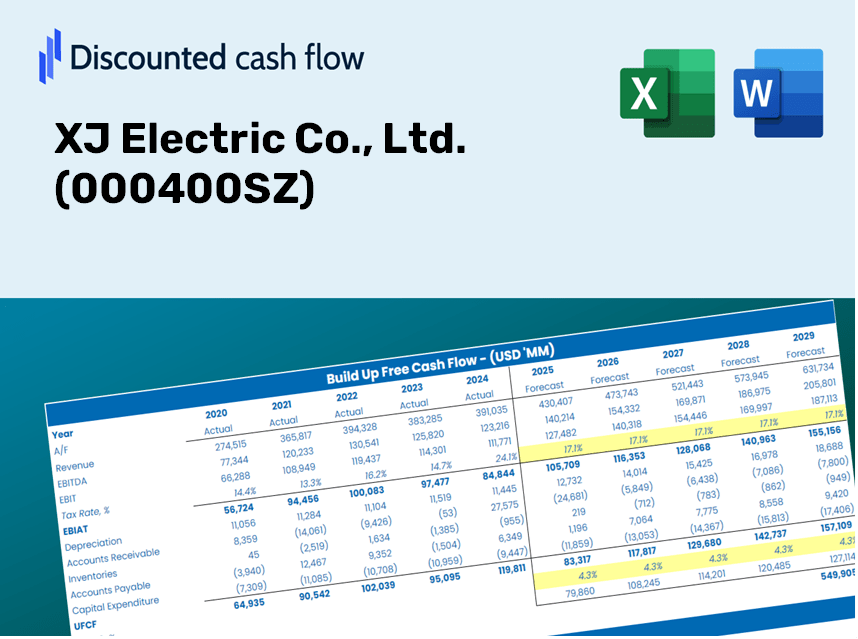
XJ Electric Co., Ltd. (000400.SZ) DCF Valuation |
Fully Editable: Tailor To Your Needs In Excel Or Sheets
Professional Design: Trusted, Industry-Standard Templates
Investor-Approved Valuation Models
MAC/PC Compatible, Fully Unlocked
No Expertise Is Needed; Easy To Follow
XJ Electric Co., Ltd. (000400.SZ) Bundle
Looking to assess the intrinsic value of XJ Electric Co., Ltd.? Our (000400SZ) DCF Calculator integrates real-world data with comprehensive customization features, enabling you to adjust forecasts and enhance your investment choices.
Discounted Cash Flow (DCF) - (USD MM)
| Year | AY1 2020 |
AY2 2021 |
AY3 2022 |
AY4 2023 |
AY5 2024 |
FY1 2025 |
FY2 2026 |
FY3 2027 |
FY4 2028 |
FY5 2029 |
|---|---|---|---|---|---|---|---|---|---|---|
| Revenue | 11,191.2 | 11,990.7 | 15,029.7 | 17,060.9 | 17,089.1 | 19,061.6 | 21,261.7 | 23,715.8 | 26,453.1 | 29,506.4 |
| Revenue Growth, % | 0 | 7.14 | 25.35 | 13.51 | 0.16551 | 11.54 | 11.54 | 11.54 | 11.54 | 11.54 |
| EBITDA | 1,140.8 | 1,189.8 | 1,359.1 | 1,421.6 | 1,626.9 | 1,792.3 | 1,999.1 | 2,229.9 | 2,487.2 | 2,774.3 |
| EBITDA, % | 10.19 | 9.92 | 9.04 | 8.33 | 9.52 | 9.4 | 9.4 | 9.4 | 9.4 | 9.4 |
| Depreciation | 242.9 | 270.9 | 287.4 | 303.8 | 300.8 | 376.8 | 420.3 | 468.8 | 522.9 | 583.2 |
| Depreciation, % | 2.17 | 2.26 | 1.91 | 1.78 | 1.76 | 1.98 | 1.98 | 1.98 | 1.98 | 1.98 |
| EBIT | 897.9 | 918.9 | 1,071.7 | 1,117.8 | 1,326.1 | 1,415.5 | 1,578.9 | 1,761.1 | 1,964.4 | 2,191.1 |
| EBIT, % | 8.02 | 7.66 | 7.13 | 6.55 | 7.76 | 7.43 | 7.43 | 7.43 | 7.43 | 7.43 |
| Total Cash | 1,739.7 | 2,854.2 | 3,698.3 | 5,015.9 | 5,554.5 | 4,798.1 | 5,351.9 | 5,969.7 | 6,658.7 | 7,427.3 |
| Total Cash, percent | .0 | .0 | .0 | .0 | .0 | .0 | .0 | .0 | .0 | .0 |
| Account Receivables | 9,220.3 | 8,245.9 | 8,411.9 | 8,947.1 | 10,939.7 | 12,336.0 | 13,759.9 | 15,348.1 | 17,119.6 | 19,095.5 |
| Account Receivables, % | 82.39 | 68.77 | 55.97 | 52.44 | 64.02 | 64.72 | 64.72 | 64.72 | 64.72 | 64.72 |
| Inventories | 2,465.2 | 2,734.5 | 2,804.4 | 2,708.4 | 2,644.4 | 3,615.6 | 4,033.0 | 4,498.4 | 5,017.7 | 5,596.8 |
| Inventories, % | 22.03 | 22.81 | 18.66 | 15.88 | 15.47 | 18.97 | 18.97 | 18.97 | 18.97 | 18.97 |
| Accounts Payable | 5,692.2 | 5,329.5 | 5,907.3 | 7,814.7 | 9,732.4 | 9,049.3 | 10,093.8 | 11,258.8 | 12,558.3 | 14,007.8 |
| Accounts Payable, % | 50.86 | 44.45 | 39.3 | 45.8 | 56.95 | 47.47 | 47.47 | 47.47 | 47.47 | 47.47 |
| Capital Expenditure | -66.9 | -149.8 | -108.0 | -212.4 | -390.1 | -232.3 | -259.1 | -289.0 | -322.3 | -359.5 |
| Capital Expenditure, % | -0.59735 | -1.25 | -0.71885 | -1.24 | -2.28 | -1.22 | -1.22 | -1.22 | -1.22 | -1.22 |
| Tax Rate, % | 20.99 | 20.99 | 20.99 | 20.99 | 20.99 | 20.99 | 20.99 | 20.99 | 20.99 | 20.99 |
| EBITAT | 708.4 | 692.4 | 756.4 | 909.8 | 1,047.8 | 1,090.6 | 1,216.4 | 1,356.8 | 1,513.4 | 1,688.1 |
| Depreciation | ||||||||||
| Changes in Account Receivables | ||||||||||
| Changes in Inventories | ||||||||||
| Changes in Accounts Payable | ||||||||||
| Capital Expenditure | ||||||||||
| UFCF | -5,108.7 | 1,155.9 | 1,277.7 | 2,469.2 | 947.7 | -1,815.6 | 580.9 | 648.0 | 722.8 | 806.2 |
| WACC, % | 8.69 | 8.69 | 8.69 | 8.7 | 8.69 | 8.69 | 8.69 | 8.69 | 8.69 | 8.69 |
| PV UFCF | ||||||||||
| SUM PV UFCF | 375.2 | |||||||||
| Long Term Growth Rate, % | 3.00 | |||||||||
| Free cash flow (T + 1) | 830 | |||||||||
| Terminal Value | 14,586 | |||||||||
| Present Terminal Value | 9,614 | |||||||||
| Enterprise Value | 9,990 | |||||||||
| Net Debt | -5,298 | |||||||||
| Equity Value | 15,288 | |||||||||
| Diluted Shares Outstanding, MM | 1,014 | |||||||||
| Equity Value Per Share | 15.08 |
What You Will Receive
- Customizable Excel Template: A fully adaptable Excel-based DCF Calculator featuring pre-filled financial data for XJ Electric Co., Ltd. (000400SZ).
- Accurate Data Insights: Historical performance data and forward-looking projections (visible in the highlighted cells).
- Adaptable Forecasts: Modify key assumptions such as revenue growth, EBITDA margin, and WACC as needed.
- Instant Calculations: Quickly assess how your inputs influence the valuation of XJ Electric Co., Ltd. (000400SZ).
- Professional Resource: Designed for investors, CFOs, consultants, and financial analysts.
- User-Centric Design: Organized for straightforward navigation, complete with clear, step-by-step guidance.
Key Features
- 🔍 Real-Life XJ Electric Financials: Pre-filled historical and projected data for XJ Electric Co., Ltd. (000400SZ).
- ✏️ Fully Customizable Inputs: Adjust all key parameters (yellow cells) such as WACC, growth %, and tax rates.
- 📊 Professional DCF Valuation: Integrated formulas calculate XJ Electric’s intrinsic value using the Discounted Cash Flow method.
- ⚡ Instant Results: Immediately visualize XJ Electric’s valuation upon making adjustments.
- Scenario Analysis: Evaluate and compare outcomes for different financial assumptions side-by-side.
How It Works
- 1. Access the Template: Download and open the Excel file containing XJ Electric Co., Ltd.'s preloaded data.
- 2. Modify Assumptions: Adjust key parameters such as growth projections, WACC, and capital expenditures.
- 3. See Results in Real-Time: The DCF model automatically computes intrinsic value and NPV.
- 4. Explore Scenarios: Analyze various forecasts to evaluate different valuation results.
- 5. Present with Assurance: Showcase professional valuation analyses to aid your decision-making.
Why Choose This Calculator for XJ Electric Co., Ltd. (000400SZ)?
- Designed for Professionals: A sophisticated tool utilized by analysts, CFOs, and consultants in the industry.
- Accurate Financial Data: XJ Electric’s historical and projected financials are preloaded for precision.
- Flexible Scenario Analysis: Easily simulate various forecasts and assumptions for informed decision-making.
- Comprehensive Outputs: Instantly calculates intrinsic value, NPV, and other essential metrics.
- User-Friendly Interface: Step-by-step guidance helps you navigate the calculator effortlessly.
Who Should Consider XJ Electric Co., Ltd.?
- Electrical Engineering Students: Understand and apply industry-standard practices using real-world data.
- Researchers: Utilize advanced models in your studies or investigations related to the electrical engineering sector.
- Investors: Validate your investment strategies and evaluate valuation metrics for XJ Electric Co., Ltd. (000400SZ).
- Market Analysts: Enhance your analytical processes with an adaptable financial model tailored for XJ Electric Co., Ltd. (000400SZ).
- Entrepreneurs: Discover how major players like XJ Electric Co., Ltd. (000400SZ) are assessed in the market.
Contents of the Template
- Comprehensive DCF Model: Editable template featuring extensive valuation calculations.
- Real-World Data: XJ Electric Co., Ltd.'s (000400SZ) historical and projected financials preloaded for analysis.
- Customizable Parameters: Modify WACC, growth rates, and tax assumptions to explore various scenarios.
- Financial Statements: Detailed annual and quarterly breakdowns for enhanced insights.
- Key Ratios: Integrated analysis of profitability, efficiency, and leverage metrics.
- Dashboard with Visual Outputs: Charts and tables designed for clear, actionable results.
Disclaimer
All information, articles, and product details provided on this website are for general informational and educational purposes only. We do not claim any ownership over, nor do we intend to infringe upon, any trademarks, copyrights, logos, brand names, or other intellectual property mentioned or depicted on this site. Such intellectual property remains the property of its respective owners, and any references here are made solely for identification or informational purposes, without implying any affiliation, endorsement, or partnership.
We make no representations or warranties, express or implied, regarding the accuracy, completeness, or suitability of any content or products presented. Nothing on this website should be construed as legal, tax, investment, financial, medical, or other professional advice. In addition, no part of this site—including articles or product references—constitutes a solicitation, recommendation, endorsement, advertisement, or offer to buy or sell any securities, franchises, or other financial instruments, particularly in jurisdictions where such activity would be unlawful.
All content is of a general nature and may not address the specific circumstances of any individual or entity. It is not a substitute for professional advice or services. Any actions you take based on the information provided here are strictly at your own risk. You accept full responsibility for any decisions or outcomes arising from your use of this website and agree to release us from any liability in connection with your use of, or reliance upon, the content or products found herein.