
|
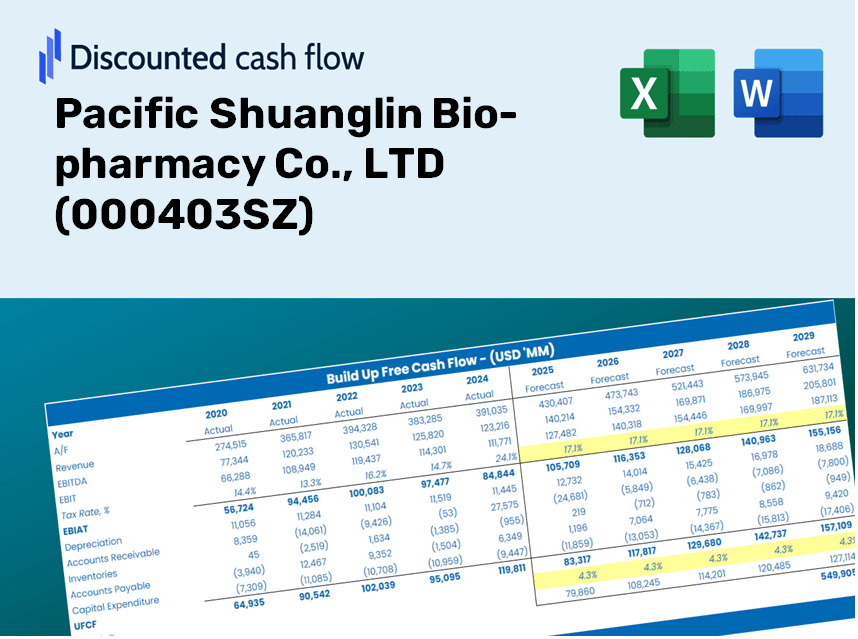
Pacific Shuanglin Bio-pharmacy Co., LTD (000403.SZ) DCF Valuation |
Fully Editable: Tailor To Your Needs In Excel Or Sheets
Professional Design: Trusted, Industry-Standard Templates
Investor-Approved Valuation Models
MAC/PC Compatible, Fully Unlocked
No Expertise Is Needed; Easy To Follow
Pacific Shuanglin Bio-pharmacy Co., LTD (000403.SZ) Bundle
Whether you're an investor or an analyst, this (000403SZ) DCF Calculator is your go-to resource for accurate valuation. Preloaded with real data from Pacific Shuanglin Bio-pharmacy Co., LTD, you can adjust forecasts and observe the results in real-time.
Discounted Cash Flow (DCF) - (USD MM)
| Year | AY1 2020 |
AY2 2021 |
AY3 2022 |
AY4 2023 |
AY5 2024 |
FY1 2025 |
FY2 2026 |
FY3 2027 |
FY4 2028 |
FY5 2029 |
|---|---|---|---|---|---|---|---|---|---|---|
| Revenue | 1,049.9 | 1,971.7 | 2,405.2 | 2,328.7 | 2,654.7 | 3,455.1 | 4,496.7 | 5,852.5 | 7,616.9 | 9,913.4 |
| Revenue Growth, % | 0 | 87.8 | 21.98 | -3.18 | 14 | 30.15 | 30.15 | 30.15 | 30.15 | 30.15 |
| EBITDA | 283.9 | 593.8 | 803.5 | 844.2 | 994.0 | 1,135.0 | 1,477.2 | 1,922.5 | 2,502.2 | 3,256.6 |
| EBITDA, % | 27.04 | 30.11 | 33.41 | 36.25 | 37.44 | 32.85 | 32.85 | 32.85 | 32.85 | 32.85 |
| Depreciation | 55.7 | 123.1 | 130.8 | 146.1 | 131.4 | 195.0 | 253.8 | 330.3 | 429.8 | 559.4 |
| Depreciation, % | 5.31 | 6.25 | 5.44 | 6.27 | 4.95 | 5.64 | 5.64 | 5.64 | 5.64 | 5.64 |
| EBIT | 228.1 | 470.6 | 672.7 | 698.1 | 862.6 | 940.0 | 1,223.4 | 1,592.3 | 2,072.3 | 2,697.1 |
| EBIT, % | 21.73 | 23.87 | 27.97 | 29.98 | 32.49 | 27.21 | 27.21 | 27.21 | 27.21 | 27.21 |
| Total Cash | 102.8 | 1,119.9 | 1,423.2 | 1,852.7 | 1,603.8 | 1,836.3 | 2,389.9 | 3,110.4 | 4,048.2 | 5,268.7 |
| Total Cash, percent | .0 | .0 | .0 | .0 | .0 | .0 | .0 | .0 | .0 | .0 |
| Account Receivables | 314.2 | 581.1 | 891.1 | 635.1 | 716.8 | 1,041.5 | 1,355.5 | 1,764.2 | 2,296.0 | 2,988.3 |
| Account Receivables, % | 29.92 | 29.47 | 37.05 | 27.27 | 27 | 30.14 | 30.14 | 30.14 | 30.14 | 30.14 |
| Inventories | 441.8 | 739.0 | 623.7 | 909.4 | 1,233.2 | 1,319.8 | 1,717.7 | 2,235.5 | 2,909.5 | 3,786.7 |
| Inventories, % | 42.07 | 37.48 | 25.93 | 39.05 | 46.46 | 38.2 | 38.2 | 38.2 | 38.2 | 38.2 |
| Accounts Payable | 45.5 | 170.8 | 158.4 | 154.3 | 224.3 | 239.5 | 311.6 | 405.6 | 527.9 | 687.1 |
| Accounts Payable, % | 4.33 | 8.66 | 6.58 | 6.63 | 8.45 | 6.93 | 6.93 | 6.93 | 6.93 | 6.93 |
| Capital Expenditure | -40.2 | -326.2 | -378.6 | -377.3 | -520.7 | -497.0 | -646.9 | -841.9 | -1,095.7 | -1,426.1 |
| Capital Expenditure, % | -3.83 | -16.54 | -15.74 | -16.2 | -19.61 | -14.39 | -14.39 | -14.39 | -14.39 | -14.39 |
| Tax Rate, % | 12.6 | 12.6 | 12.6 | 12.6 | 12.6 | 12.6 | 12.6 | 12.6 | 12.6 | 12.6 |
| EBITAT | 195.3 | 401.8 | 598.0 | 621.0 | 753.9 | 820.2 | 1,067.5 | 1,389.3 | 1,808.2 | 2,353.3 |
| Depreciation | ||||||||||
| Changes in Account Receivables | ||||||||||
| Changes in Inventories | ||||||||||
| Changes in Accounts Payable | ||||||||||
| Capital Expenditure | ||||||||||
| UFCF | -499.6 | -240.1 | 143.1 | 356.1 | 28.9 | 122.2 | 34.7 | 45.1 | 58.7 | 76.4 |
| WACC, % | 6.35 | 6.35 | 6.36 | 6.36 | 6.36 | 6.36 | 6.36 | 6.36 | 6.36 | 6.36 |
| PV UFCF | ||||||||||
| SUM PV UFCF | 285.1 | |||||||||
| Long Term Growth Rate, % | 3.00 | |||||||||
| Free cash flow (T + 1) | 79 | |||||||||
| Terminal Value | 2,344 | |||||||||
| Present Terminal Value | 1,723 | |||||||||
| Enterprise Value | 2,008 | |||||||||
| Net Debt | -689 | |||||||||
| Equity Value | 2,696 | |||||||||
| Diluted Shares Outstanding, MM | 731 | |||||||||
| Equity Value Per Share | 3.69 |
Benefits You Will Receive
- Comprehensive Financial Model: Utilize actual data from Pacific Shuanglin Bio-pharmacy Co., LTD to achieve accurate DCF valuation.
- Complete Forecast Customization: Modify key parameters such as revenue growth, profit margins, WACC, and other essential drivers.
- Real-Time Calculations: Automatic updates provide immediate feedback as you adjust inputs.
- Professional-Grade Template: A polished Excel file specifically crafted for high-quality valuation presentations.
- Flexible and Reusable: Designed for adaptability, allowing for repeated use in detailed forecasting scenarios.
Key Features
- Comprehensive DCF Calculator: Utilizes detailed unlevered and levered DCF valuation models tailored for Pacific Shuanglin Bio-pharmacy Co., LTD (000403SZ).
- WACC Calculator: Features a pre-configured Weighted Average Cost of Capital sheet with adjustable inputs.
- Customizable Forecast Assumptions: Easily modify projections for growth rates, capital expenditures, and discount rates.
- Integrated Financial Ratios: Assess profitability, leverage, and operational efficiency ratios specific to Pacific Shuanglin Bio-pharmacy Co., LTD (000403SZ).
- Dashboards and Charts: Visual representations that highlight essential valuation metrics for streamlined analysis.
How It Works
- Download the Template: Gain immediate access to the Excel-based (000403SZ) DCF Calculator.
- Input Your Assumptions: Modify the yellow-highlighted cells for growth rates, WACC, margins, and other variables.
- Instant Calculations: The model will automatically refresh to display the intrinsic value of Pacific Shuanglin Bio-pharmacy Co., LTD.
- Test Scenarios: Experiment with various assumptions to assess how they impact valuation outcomes.
- Analyze and Decide: Leverage the results to inform your investment or financial strategies.
Why Select This Calculator for Pacific Shuanglin Bio-pharmacy Co., LTD (000403SZ)?
- All-in-One Solution: Combines DCF, WACC, and financial ratio analyses in a single user-friendly tool.
- Flexible Customization: Modify the yellow-highlighted cells to explore different financial scenarios.
- In-Depth Analysis: Automatically computes the intrinsic value and Net Present Value for Pacific Shuanglin Bio-pharmacy (000403SZ).
- Preloaded Information: Historical and forecasted data provide a solid foundation for accurate assessments.
- High-Quality Standards: Perfectly suited for financial analysts, investors, and business consultants focused on (000403SZ).
Who Can Benefit from Our Product?
- Investors: Empower your investment choices with our advanced valuation tool, specifically designed for informed decision-making.
- Financial Analysts: Enhance your productivity with our customizable, pre-built DCF model that saves you valuable time.
- Consultants: Effortlessly tailor the template to suit client presentations and reports, ensuring quick adaptability.
- Finance Enthusiasts: Expand your knowledge of valuation methods through practical, real-world examples and applications.
- Educators and Students: Utilize our product as an effective learning resource in finance courses, enhancing the educational experience.
Contents of the Template
- Operating and Balance Sheet Data: Pre-filled historical data and forecasts for Pacific Shuanglin Bio-pharmacy Co., LTD (000403SZ), including revenue, EBITDA, EBIT, and capital expenditures.
- WACC Calculation: A separate sheet dedicated to calculating the Weighted Average Cost of Capital (WACC), featuring parameters such as Beta, risk-free rate, and share price.
- DCF Valuation (Unlevered and Levered): Customizable Discounted Cash Flow models that illustrate intrinsic value with comprehensive calculations.
- Financial Statements: Pre-loaded financial statements (annual and quarterly) to facilitate thorough analysis.
- Key Ratios: A collection of profitability, leverage, and efficiency ratios specific to Pacific Shuanglin Bio-pharmacy Co., LTD (000403SZ).
- Dashboard and Charts: Visual summaries of valuation outputs and assumptions to simplify result analysis.
Disclaimer
All information, articles, and product details provided on this website are for general informational and educational purposes only. We do not claim any ownership over, nor do we intend to infringe upon, any trademarks, copyrights, logos, brand names, or other intellectual property mentioned or depicted on this site. Such intellectual property remains the property of its respective owners, and any references here are made solely for identification or informational purposes, without implying any affiliation, endorsement, or partnership.
We make no representations or warranties, express or implied, regarding the accuracy, completeness, or suitability of any content or products presented. Nothing on this website should be construed as legal, tax, investment, financial, medical, or other professional advice. In addition, no part of this site—including articles or product references—constitutes a solicitation, recommendation, endorsement, advertisement, or offer to buy or sell any securities, franchises, or other financial instruments, particularly in jurisdictions where such activity would be unlawful.
All content is of a general nature and may not address the specific circumstances of any individual or entity. It is not a substitute for professional advice or services. Any actions you take based on the information provided here are strictly at your own risk. You accept full responsibility for any decisions or outcomes arising from your use of this website and agree to release us from any liability in connection with your use of, or reliance upon, the content or products found herein.