
|
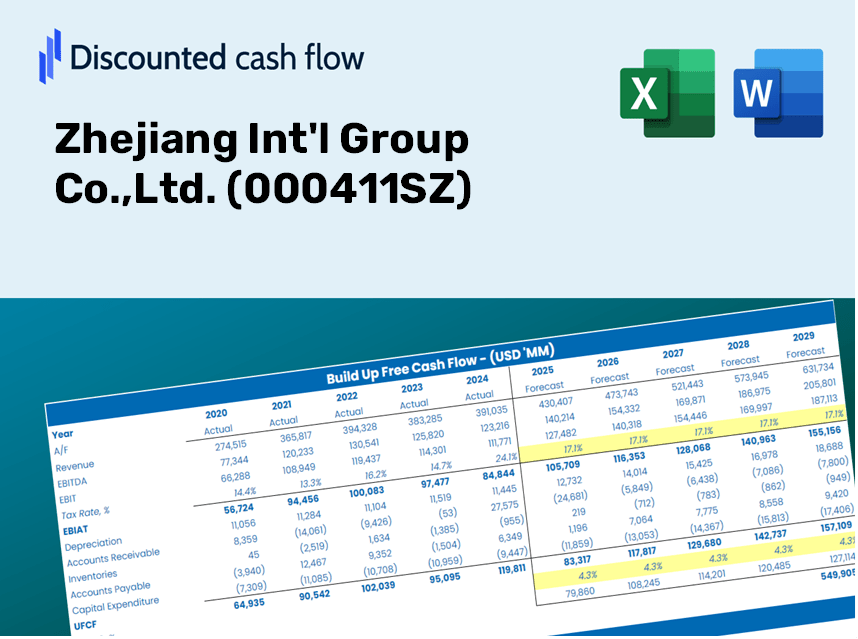
Zhejiang Int'l Group Co.,Ltd. (000411.SZ) DCF Valuation |
Fully Editable: Tailor To Your Needs In Excel Or Sheets
Professional Design: Trusted, Industry-Standard Templates
Investor-Approved Valuation Models
MAC/PC Compatible, Fully Unlocked
No Expertise Is Needed; Easy To Follow
Zhejiang Int'l Group Co.,Ltd. (000411.SZ) Bundle
Designed for accuracy, our (000411SZ) DCF Calculator allows you to evaluate Zhejiang Int'l Group Co., Ltd. valuation using real-world financial data, offering complete flexibility to modify all essential parameters for enhanced projections.
Discounted Cash Flow (DCF) - (USD MM)
| Year | AY1 2020 |
AY2 2021 |
AY3 2022 |
AY4 2023 |
AY5 2024 |
FY1 2025 |
FY2 2026 |
FY3 2027 |
FY4 2028 |
FY5 2029 |
|---|---|---|---|---|---|---|---|---|---|---|
| Revenue | 25,008.2 | 26,731.0 | 30,619.3 | 32,052.1 | 33,351.7 | 35,867.1 | 38,572.3 | 41,481.5 | 44,610.1 | 47,974.7 |
| Revenue Growth, % | 0 | 6.89 | 14.55 | 4.68 | 4.05 | 7.54 | 7.54 | 7.54 | 7.54 | 7.54 |
| EBITDA | 680.0 | 827.7 | 933.1 | 1,141.6 | 1,152.7 | 1,139.2 | 1,225.1 | 1,317.5 | 1,416.9 | 1,523.7 |
| EBITDA, % | 2.72 | 3.1 | 3.05 | 3.56 | 3.46 | 3.18 | 3.18 | 3.18 | 3.18 | 3.18 |
| Depreciation | 88.6 | 135.9 | 165.1 | 171.6 | 190.8 | 180.0 | 193.6 | 208.2 | 223.9 | 240.8 |
| Depreciation, % | 0.35433 | 0.50823 | 0.53925 | 0.53547 | 0.57212 | 0.50188 | 0.50188 | 0.50188 | 0.50188 | 0.50188 |
| EBIT | 591.3 | 691.8 | 768.0 | 970.0 | 961.8 | 959.2 | 1,031.5 | 1,109.3 | 1,193.0 | 1,283.0 |
| EBIT, % | 2.36 | 2.59 | 2.51 | 3.03 | 2.88 | 2.67 | 2.67 | 2.67 | 2.67 | 2.67 |
| Total Cash | 1,821.8 | 1,902.5 | 864.9 | 1,607.1 | 1,594.5 | 1,938.4 | 2,084.5 | 2,241.8 | 2,410.8 | 2,592.7 |
| Total Cash, percent | .0 | .0 | .0 | .0 | .0 | .0 | .0 | .0 | .0 | .0 |
| Account Receivables | 5,241.6 | 5,450.1 | 6,990.7 | 6,629.8 | 6,926.3 | 7,577.4 | 8,148.9 | 8,763.5 | 9,424.5 | 10,135.3 |
| Account Receivables, % | 20.96 | 20.39 | 22.83 | 20.68 | 20.77 | 21.13 | 21.13 | 21.13 | 21.13 | 21.13 |
| Inventories | 2,597.9 | 2,896.7 | 3,461.0 | 3,570.8 | 3,736.4 | 3,936.2 | 4,233.1 | 4,552.3 | 4,895.7 | 5,264.9 |
| Inventories, % | 10.39 | 10.84 | 11.3 | 11.14 | 11.2 | 10.97 | 10.97 | 10.97 | 10.97 | 10.97 |
| Accounts Payable | 4,377.4 | 3,636.2 | 5,285.7 | 5,541.2 | 5,611.6 | 5,916.8 | 6,363.1 | 6,843.0 | 7,359.1 | 7,914.2 |
| Accounts Payable, % | 17.5 | 13.6 | 17.26 | 17.29 | 16.83 | 16.5 | 16.5 | 16.5 | 16.5 | 16.5 |
| Capital Expenditure | -178.5 | -189.1 | -107.4 | -168.4 | -279.9 | -225.0 | -241.9 | -260.2 | -279.8 | -300.9 |
| Capital Expenditure, % | -0.7137 | -0.70739 | -0.35063 | -0.52528 | -0.83927 | -0.62725 | -0.62725 | -0.62725 | -0.62725 | -0.62725 |
| Tax Rate, % | 34.54 | 34.54 | 34.54 | 34.54 | 34.54 | 34.54 | 34.54 | 34.54 | 34.54 | 34.54 |
| EBITAT | 434.7 | 506.9 | 567.3 | 591.6 | 629.6 | 665.8 | 716.0 | 770.1 | 828.1 | 890.6 |
| Depreciation | ||||||||||
| Changes in Account Receivables | ||||||||||
| Changes in Inventories | ||||||||||
| Changes in Accounts Payable | ||||||||||
| Capital Expenditure | ||||||||||
| UFCF | -3,117.3 | -794.9 | 169.6 | 1,101.6 | 148.7 | 75.3 | 245.6 | 264.1 | 284.0 | 305.4 |
| WACC, % | 4.62 | 4.62 | 4.63 | 4.39 | 4.47 | 4.55 | 4.55 | 4.55 | 4.55 | 4.55 |
| PV UFCF | ||||||||||
| SUM PV UFCF | 1,010.1 | |||||||||
| Long Term Growth Rate, % | 3.50 | |||||||||
| Free cash flow (T + 1) | 316 | |||||||||
| Terminal Value | 30,230 | |||||||||
| Present Terminal Value | 24,205 | |||||||||
| Enterprise Value | 25,215 | |||||||||
| Net Debt | 761 | |||||||||
| Equity Value | 24,454 | |||||||||
| Diluted Shares Outstanding, MM | 538 | |||||||||
| Equity Value Per Share | 45.43 |
Benefits You'll Receive
- Authentic Zhejiang Int'l Group Data: Comprehensive financials – encompassing revenue to EBIT – derived from actual and projected metrics.
- Complete Customization: Modify all key parameters (yellow cells) including WACC, growth %, and tax rates to fit your analysis.
- Immediate Valuation Adjustments: Automatic recalculations to assess the effects of changes on Zhejiang Int'l Group's fair value.
- Flexible Excel Template: Designed for quick modifications, scenario analysis, and in-depth forecasting.
- Efficient and Precise: Bypass the complexity of building models from the ground up while ensuring accuracy and adaptability.
Key Features
- Customizable Forecast Inputs: Adjust essential factors such as revenue growth, EBITDA percentage, and capital expenditures tailored to Zhejiang Int'l Group Co.,Ltd. (000411SZ).
- Instant DCF Valuation: Quickly computes intrinsic value, NPV, and additional metrics for informed decision-making.
- High-Precision Accuracy: Leverages Zhejiang Int'l Group's actual financial data for credible and realistic valuation results.
- Effortless Scenario Analysis: Easily evaluate various assumptions and compare potential outcomes with a few clicks.
- Efficiency Booster: Streamlines the valuation process, removing the hassle of constructing complex models from the ground up.
How It Operates
- Step 1: Download the Excel spreadsheet.
- Step 2: Examine the pre-filled Zhejiang Int'l Group Co., Ltd. (000411SZ) data (both historical and projected).
- Step 3: Modify key assumptions (highlighted in yellow) according to your findings.
- Step 4: Observe the automatic updates for Zhejiang Int'l Group Co., Ltd.'s (000411SZ) intrinsic value.
- Step 5: Utilize the results for investment choices or financial reporting.
Why Choose This Calculator for Zhejiang Int'l Group Co., Ltd. (000411SZ)?
- User-Friendly Design: Perfect for both novices and seasoned professionals.
- Customizable Parameters: Adjust inputs easily to tailor your financial analysis.
- Real-Time Updates: Observe immediate changes to Zhejiang Int'l Group's valuation as you modify the inputs.
- Preloaded Data: Comes with Zhejiang Int'l Group's actual financial information for swift evaluations.
- Preferred by Experts: A valuable tool for investors and analysts to make well-informed choices.
Who Can Benefit from This Product?
- Finance Students: Understand valuation methodologies and implement them using real-world data.
- Academics: Enhance your curriculum or research with established models from the industry.
- Investors: Examine your own hypotheses and evaluate valuation projections for Zhejiang Int'l Group Co.,Ltd. (000411SZ).
- Analysts: Optimize your analysis processes with a ready-to-use, adaptable DCF model.
- Small Business Owners: Discover how major public companies like Zhejiang Int'l Group Co.,Ltd. (000411SZ) are evaluated in the market.
Contents of the Template
- Historical Data: Provides a comprehensive overview of Zhejiang Int'l Group Co., Ltd.'s past financial performance and baseline forecasts.
- DCF and Levered DCF Models: In-depth templates designed to assess the intrinsic value of Zhejiang Int'l Group Co.,Ltd. (000411SZ).
- WACC Sheet: Pre-configured calculations for the Weighted Average Cost of Capital.
- Editable Inputs: Customize key variables such as growth rates, EBITDA percentages, and CAPEX projections.
- Quarterly and Annual Statements: Thorough breakdown of Zhejiang Int'l Group Co., Ltd.'s financial reports.
- Interactive Dashboard: A dynamic interface to visualize valuation outcomes and forecasts.
Disclaimer
All information, articles, and product details provided on this website are for general informational and educational purposes only. We do not claim any ownership over, nor do we intend to infringe upon, any trademarks, copyrights, logos, brand names, or other intellectual property mentioned or depicted on this site. Such intellectual property remains the property of its respective owners, and any references here are made solely for identification or informational purposes, without implying any affiliation, endorsement, or partnership.
We make no representations or warranties, express or implied, regarding the accuracy, completeness, or suitability of any content or products presented. Nothing on this website should be construed as legal, tax, investment, financial, medical, or other professional advice. In addition, no part of this site—including articles or product references—constitutes a solicitation, recommendation, endorsement, advertisement, or offer to buy or sell any securities, franchises, or other financial instruments, particularly in jurisdictions where such activity would be unlawful.
All content is of a general nature and may not address the specific circumstances of any individual or entity. It is not a substitute for professional advice or services. Any actions you take based on the information provided here are strictly at your own risk. You accept full responsibility for any decisions or outcomes arising from your use of this website and agree to release us from any liability in connection with your use of, or reliance upon, the content or products found herein.