
|
Jilin Chemical Fibre Stock Co.,Ltd (000420.SZ) DCF Valuation |
Fully Editable: Tailor To Your Needs In Excel Or Sheets
Professional Design: Trusted, Industry-Standard Templates
Investor-Approved Valuation Models
MAC/PC Compatible, Fully Unlocked
No Expertise Is Needed; Easy To Follow
Jilin Chemical Fibre Stock Co.,Ltd (000420.SZ) Bundle
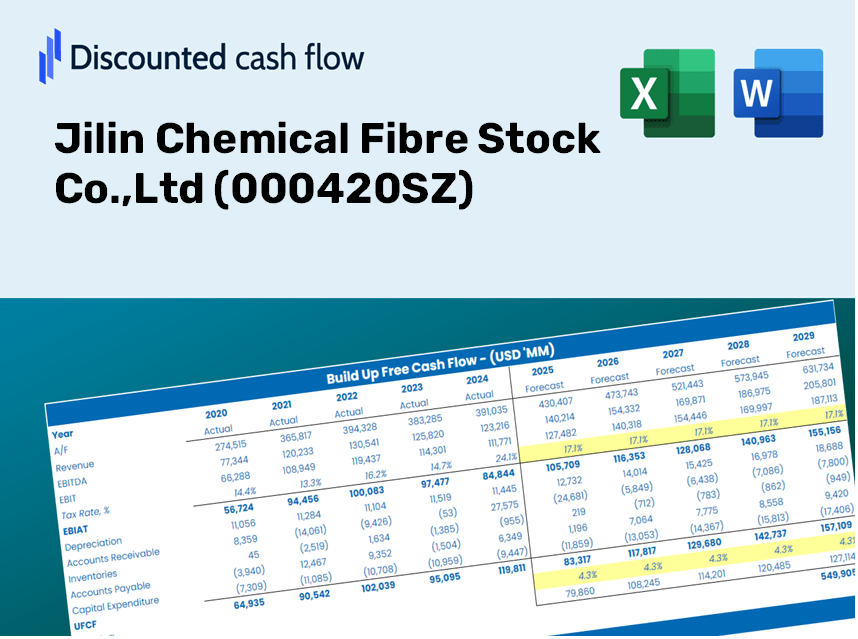
Gain insight into your Jilin Chemical Fibre Stock Co., Ltd (000420SZ) valuation analysis with our state-of-the-art DCF Calculator! This Excel template comes preloaded with real (000420SZ) data, enabling you to adjust forecasts and assumptions to determine the intrinsic value of Jilin Chemical Fibre Stock Co., Ltd with accuracy.
Discounted Cash Flow (DCF) - (USD MM)
| Year | AY1 2020 |
AY2 2021 |
AY3 2022 |
AY4 2023 |
AY5 2024 |
FY1 2025 |
FY2 2026 |
FY3 2027 |
FY4 2028 |
FY5 2029 |
|---|---|---|---|---|---|---|---|---|---|---|
| Revenue | 2,499.7 | 3,580.2 | 3,669.6 | 3,736.7 | 3,883.5 | 4,383.3 | 4,947.3 | 5,584.0 | 6,302.7 | 7,113.8 |
| Revenue Growth, % | 0 | 43.22 | 2.5 | 1.83 | 3.93 | 12.87 | 12.87 | 12.87 | 12.87 | 12.87 |
| EBITDA | 351.8 | 455.6 | 542.1 | 814.1 | 829.3 | 742.7 | 838.2 | 946.1 | 1,067.9 | 1,205.3 |
| EBITDA, % | 14.07 | 12.73 | 14.77 | 21.79 | 21.36 | 16.94 | 16.94 | 16.94 | 16.94 | 16.94 |
| Depreciation | 331.5 | 330.2 | 421.5 | 547.6 | 546.2 | 549.6 | 620.3 | 700.1 | 790.2 | 891.9 |
| Depreciation, % | 13.26 | 9.22 | 11.49 | 14.65 | 14.07 | 12.54 | 12.54 | 12.54 | 12.54 | 12.54 |
| EBIT | 20.3 | 125.4 | 120.7 | 266.5 | 283.1 | 193.1 | 217.9 | 246.0 | 277.7 | 313.4 |
| EBIT, % | 0.8139 | 3.5 | 3.29 | 7.13 | 7.29 | 4.41 | 4.41 | 4.41 | 4.41 | 4.41 |
| Total Cash | 885.6 | 741.0 | 894.6 | 677.2 | 1,029.3 | 1,097.0 | 1,238.1 | 1,397.5 | 1,577.3 | 1,780.3 |
| Total Cash, percent | .0 | .0 | .0 | .0 | .0 | .0 | .0 | .0 | .0 | .0 |
| Account Receivables | 613.9 | 509.7 | 809.6 | 952.0 | 1,008.2 | 984.5 | 1,111.1 | 1,254.1 | 1,415.5 | 1,597.7 |
| Account Receivables, % | 24.56 | 14.24 | 22.06 | 25.48 | 25.96 | 22.46 | 22.46 | 22.46 | 22.46 | 22.46 |
| Inventories | 730.9 | 794.8 | 455.9 | 675.2 | 683.9 | 872.6 | 984.9 | 1,111.7 | 1,254.8 | 1,416.2 |
| Inventories, % | 29.24 | 22.2 | 12.42 | 18.07 | 17.61 | 19.91 | 19.91 | 19.91 | 19.91 | 19.91 |
| Accounts Payable | 1,900.0 | 2,338.7 | 2,491.5 | 1,984.6 | 2,631.5 | 2,893.8 | 3,266.2 | 3,686.5 | 4,161.0 | 4,696.5 |
| Accounts Payable, % | 76.01 | 65.32 | 67.9 | 53.11 | 67.76 | 66.02 | 66.02 | 66.02 | 66.02 | 66.02 |
| Capital Expenditure | -112.8 | -87.4 | -420.0 | -574.0 | -432.0 | -393.5 | -444.1 | -501.3 | -565.8 | -638.6 |
| Capital Expenditure, % | -4.51 | -2.44 | -11.45 | -15.36 | -11.12 | -8.98 | -8.98 | -8.98 | -8.98 | -8.98 |
| Tax Rate, % | 0.95588 | 0.95588 | 0.95588 | 0.95588 | 0.95588 | 0.95588 | 0.95588 | 0.95588 | 0.95588 | 0.95588 |
| EBITAT | 16.9 | 120.8 | 127.9 | 714.3 | 280.4 | 184.9 | 208.7 | 235.5 | 265.8 | 300.0 |
| Depreciation | ||||||||||
| Changes in Account Receivables | ||||||||||
| Changes in Inventories | ||||||||||
| Changes in Accounts Payable | ||||||||||
| Capital Expenditure | ||||||||||
| UFCF | 790.9 | 842.5 | 321.2 | -180.7 | 976.6 | 438.3 | 518.3 | 585.0 | 660.2 | 745.2 |
| WACC, % | 5.69 | 5.94 | 6 | 6 | 5.99 | 5.92 | 5.92 | 5.92 | 5.92 | 5.92 |
| PV UFCF | ||||||||||
| SUM PV UFCF | 2,451.2 | |||||||||
| Long Term Growth Rate, % | 2.00 | |||||||||
| Free cash flow (T + 1) | 760 | |||||||||
| Terminal Value | 19,370 | |||||||||
| Present Terminal Value | 14,526 | |||||||||
| Enterprise Value | 16,977 | |||||||||
| Net Debt | 3,211 | |||||||||
| Equity Value | 13,766 | |||||||||
| Diluted Shares Outstanding, MM | 2,452 | |||||||||
| Equity Value Per Share | 5.61 |
What You Will Receive
- Customizable Excel Template: A fully adaptable Excel-based DCF Calculator featuring pre-filled financial data for Jilin Chemical Fibre Stock Co., Ltd (000420SZ).
- Comprehensive Data: Access to historical performance metrics and future projections (highlighted in the yellow cells).
- Assumption Flexibility: Modify key assumptions such as revenue growth rates, EBITDA percentages, and WACC.
- Real-Time Calculations: Instantly observe how your inputs affect the valuation of Jilin Chemical Fibre Stock Co., Ltd (000420SZ).
- Professional-Grade Tool: Designed for use by investors, CFOs, consultants, and financial analysts.
- Intuitive Layout: Organized for clarity and ease of navigation, complete with detailed instructions.
Core Features
- 🔍 Real-Time Jilin Chemical Fibre Financials: Pre-loaded historical and forecasted data for Jilin Chemical Fibre Stock Co., Ltd (000420SZ).
- ✏️ Fully Adjustable Inputs: Modify essential parameters (yellow cells) such as WACC, growth %, and tax rates.
- 📊 Professional DCF Valuation: Integrated formulas determine Jilin’s intrinsic value through the Discounted Cash Flow method.
- ⚡ Immediate Results: View Jilin’s valuation instantly upon making adjustments.
- Scenario Analysis: Evaluate and contrast outcomes based on different financial assumptions side-by-side.
How It Functions
- Download the Template: Gain immediate access to the Excel-based Jilin Chemical Fibre (000420SZ) DCF Calculator.
- Input Your Assumptions: Modify the yellow-highlighted cells for growth rates, WACC, profit margins, and other variables.
- Instant Calculations: The model automatically recalculates the intrinsic value of Jilin Chemical Fibre (000420SZ).
- Test Scenarios: Experiment with different assumptions to assess potential valuation shifts.
- Analyze and Decide: Leverage the results to inform your investment or financial evaluations.
Why Opt for the Jilin Chemical Fibre Stock Co., Ltd Calculator?
- Precision: Utilizes authentic Jilin Chemical Fibre financial data for reliable results.
- Adaptability: Crafted to allow users to easily adjust and experiment with inputs.
- Efficiency: Eliminate the need to construct a financial model from the ground up.
- Expert-Level: Designed with the accuracy and functionality expected by CFOs.
- Intuitive: Simple to navigate, even for those with limited experience in financial modeling.
Who Can Benefit from This Product?
- Institutional Investors: Create comprehensive and trustworthy valuation models for analyzing their portfolios, especially for (000420SZ).
- Corporate Finance Departments: Evaluate different valuation scenarios to inform strategic decisions within their organizations.
- Consultants and Financial Advisors: Offer clients precise valuation analysis and insights pertaining to Jilin Chemical Fibre Stock Co., Ltd (000420SZ).
- Academics and Students: Utilize real-world data to enhance financial modeling skills in an educational setting.
- Chemical Industry Enthusiasts: Gain insights into how companies like Jilin Chemical Fibre Stock Co., Ltd (000420SZ) are valued in the marketplace.
Contents of the Template
- Preloaded (000420SZ) Data: Historical and projected financial information, including revenue, EBIT, and capital expenditures.
- DCF and WACC Models: Professional-grade spreadsheets for determining intrinsic value and Weighted Average Cost of Capital.
- Editable Inputs: Yellow-highlighted cells designed for customizing revenue growth, tax rates, and discount rates.
- Financial Statements: Detailed annual and quarterly financial reports for in-depth analysis.
- Key Ratios: Metrics for profitability, leverage, and efficiency to assess overall performance.
- Dashboard and Charts: Visual representations of valuation results and underlying assumptions.
Disclaimer
All information, articles, and product details provided on this website are for general informational and educational purposes only. We do not claim any ownership over, nor do we intend to infringe upon, any trademarks, copyrights, logos, brand names, or other intellectual property mentioned or depicted on this site. Such intellectual property remains the property of its respective owners, and any references here are made solely for identification or informational purposes, without implying any affiliation, endorsement, or partnership.
We make no representations or warranties, express or implied, regarding the accuracy, completeness, or suitability of any content or products presented. Nothing on this website should be construed as legal, tax, investment, financial, medical, or other professional advice. In addition, no part of this site—including articles or product references—constitutes a solicitation, recommendation, endorsement, advertisement, or offer to buy or sell any securities, franchises, or other financial instruments, particularly in jurisdictions where such activity would be unlawful.
All content is of a general nature and may not address the specific circumstances of any individual or entity. It is not a substitute for professional advice or services. Any actions you take based on the information provided here are strictly at your own risk. You accept full responsibility for any decisions or outcomes arising from your use of this website and agree to release us from any liability in connection with your use of, or reliance upon, the content or products found herein.