
|
Hubei Yihua Chemical Industry Co., Ltd. (000422.SZ) DCF Valuation |
Fully Editable: Tailor To Your Needs In Excel Or Sheets
Professional Design: Trusted, Industry-Standard Templates
Investor-Approved Valuation Models
MAC/PC Compatible, Fully Unlocked
No Expertise Is Needed; Easy To Follow
Hubei Yihua Chemical Industry Co., Ltd. (000422.SZ) Bundle
Enhance your investment choices with the Hubei Yihua Chemical Industry Co., Ltd. (000422SZ) DCF Calculator! Utilize actual financial data, adjust growth expectations and expenses, and instantly observe how these modifications affect the intrinsic value of Hubei Yihua Chemical Industry Co., Ltd. (000422SZ).
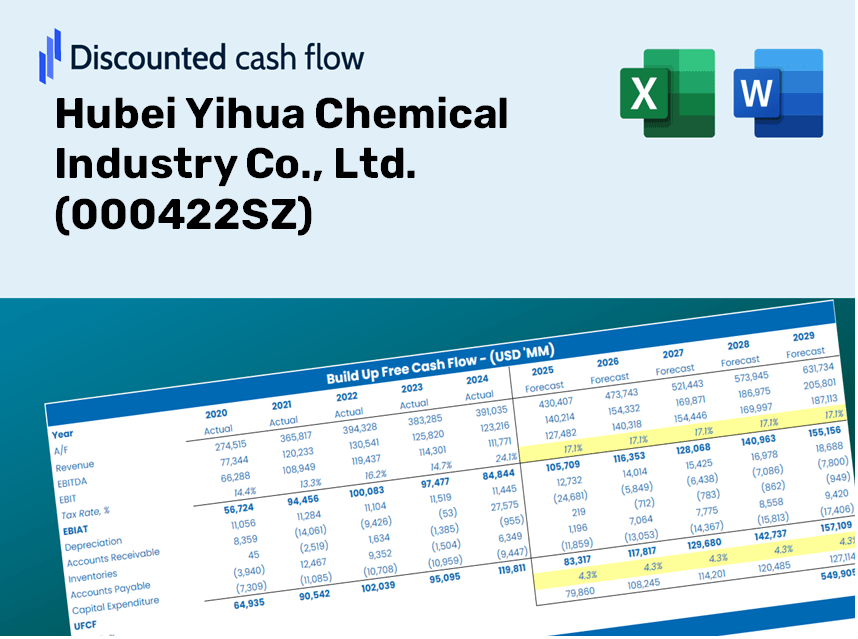
Discounted Cash Flow (DCF) - (USD MM)
| Year | AY1 2020 |
AY2 2021 |
AY3 2022 |
AY4 2023 |
AY5 2024 |
FY1 2025 |
FY2 2026 |
FY3 2027 |
FY4 2028 |
FY5 2029 |
|---|---|---|---|---|---|---|---|---|---|---|
| Revenue | 13,781.3 | 18,544.1 | 20,712.5 | 17,045.8 | 16,963.6 | 15,887.9 | 14,880.4 | 13,936.8 | 13,053.1 | 12,225.3 |
| Revenue Growth, % | 0 | 34.56 | 11.69 | -17.7 | -0.48227 | -6.34 | -6.34 | -6.34 | -6.34 | -6.34 |
| EBITDA | 1,723.4 | 4,280.5 | 3,564.0 | 1,888.8 | 1,899.3 | 2,385.5 | 2,234.2 | 2,092.6 | 1,959.9 | 1,835.6 |
| EBITDA, % | 12.51 | 23.08 | 17.21 | 11.08 | 11.2 | 15.01 | 15.01 | 15.01 | 15.01 | 15.01 |
| Depreciation | 1,074.5 | 1,103.7 | 1,097.4 | 1,118.0 | 1,225.2 | 1,043.1 | 977.0 | 915.0 | 857.0 | 802.7 |
| Depreciation, % | 7.8 | 5.95 | 5.3 | 6.56 | 7.22 | 6.57 | 6.57 | 6.57 | 6.57 | 6.57 |
| EBIT | 648.9 | 3,176.8 | 2,466.6 | 770.8 | 674.1 | 1,342.4 | 1,257.2 | 1,177.5 | 1,102.8 | 1,032.9 |
| EBIT, % | 4.71 | 17.13 | 11.91 | 4.52 | 3.97 | 8.45 | 8.45 | 8.45 | 8.45 | 8.45 |
| Total Cash | 3,226.3 | 3,843.9 | 3,419.6 | 2,970.8 | 3,242.7 | 3,088.4 | 2,892.5 | 2,709.1 | 2,537.3 | 2,376.4 |
| Total Cash, percent | .0 | .0 | .0 | .0 | .0 | .0 | .0 | .0 | .0 | .0 |
| Account Receivables | 555.2 | 615.9 | 471.7 | 399.9 | 781.2 | 526.8 | 493.4 | 462.1 | 432.8 | 405.4 |
| Account Receivables, % | 4.03 | 3.32 | 2.28 | 2.35 | 4.6 | 3.32 | 3.32 | 3.32 | 3.32 | 3.32 |
| Inventories | 1,206.9 | 1,578.0 | 1,325.8 | 1,751.5 | 1,918.5 | 1,437.9 | 1,346.7 | 1,261.3 | 1,181.4 | 1,106.4 |
| Inventories, % | 8.76 | 8.51 | 6.4 | 10.28 | 11.31 | 9.05 | 9.05 | 9.05 | 9.05 | 9.05 |
| Accounts Payable | 3,645.4 | 3,265.4 | 2,223.5 | 2,797.5 | 2,652.2 | 2,759.5 | 2,584.5 | 2,420.6 | 2,267.1 | 2,123.3 |
| Accounts Payable, % | 26.45 | 17.61 | 10.74 | 16.41 | 15.63 | 17.37 | 17.37 | 17.37 | 17.37 | 17.37 |
| Capital Expenditure | -625.7 | -969.5 | -2,240.2 | -1,748.4 | -4,664.3 | -1,853.7 | -1,736.2 | -1,626.1 | -1,523.0 | -1,426.4 |
| Capital Expenditure, % | -4.54 | -5.23 | -10.82 | -10.26 | -27.5 | -11.67 | -11.67 | -11.67 | -11.67 | -11.67 |
| Tax Rate, % | 34.8 | 34.8 | 34.8 | 34.8 | 34.8 | 34.8 | 34.8 | 34.8 | 34.8 | 34.8 |
| EBITAT | 225.9 | 2,221.4 | 1,798.1 | 360.1 | 439.5 | 777.4 | 728.1 | 681.9 | 638.7 | 598.2 |
| Depreciation | ||||||||||
| Changes in Account Receivables | ||||||||||
| Changes in Inventories | ||||||||||
| Changes in Accounts Payable | ||||||||||
| Capital Expenditure | ||||||||||
| UFCF | 2,558.0 | 1,543.7 | 9.9 | -50.2 | -3,693.0 | 809.0 | -81.5 | -76.3 | -71.5 | -66.9 |
| WACC, % | 5.59 | 6.17 | 6.22 | 5.79 | 6.09 | 5.97 | 5.97 | 5.97 | 5.97 | 5.97 |
| PV UFCF | ||||||||||
| SUM PV UFCF | 520.0 | |||||||||
| Long Term Growth Rate, % | 0.50 | |||||||||
| Free cash flow (T + 1) | -67 | |||||||||
| Terminal Value | -1,230 | |||||||||
| Present Terminal Value | -920 | |||||||||
| Enterprise Value | -400 | |||||||||
| Net Debt | 8,633 | |||||||||
| Equity Value | -9,033 | |||||||||
| Diluted Shares Outstanding, MM | 1,068 | |||||||||
| Equity Value Per Share | -8.45 |
Benefits You Will Receive
- Flexible Assumption Inputs: Easily adjust parameters (growth %, profit margins, WACC) to explore various scenarios.
- Relevant Financial Data: Hubei Yihua Chemical Industry’s financial information pre-filled to facilitate your analysis.
- Instant DCF Calculations: The template automatically computes Net Present Value (NPV) and intrinsic value for you.
- Tailored and Professional Design: A refined Excel model that can be customized to meet your valuation requirements.
- Designed for Analysts and Investors: Perfect for evaluating projections, verifying strategies, and optimizing your time.
Key Features
- Customizable Financial Metrics: Adjust essential factors such as revenue growth, EBITDA %, and capital expenditures for precise forecasting.
- Instant DCF Valuation: Automatically computes intrinsic value, NPV, and additional metrics in real-time.
- High-Precision Accuracy: Leverages Hubei Yihua Chemical Industry Co., Ltd.'s (000422SZ) actual financial data for dependable valuation results.
- Simplified Scenario Analysis: Easily evaluate various assumptions and analyze their impacts with minimal effort.
- Efficiency Booster: Avoid the complexities of developing intricate valuation models from the ground up.
How It Works
- Step 1: Download the prebuilt Excel template containing Hubei Yihua Chemical Industry Co., Ltd.'s (000422SZ) data.
- Step 2: Review the pre-filled sheets to familiarize yourself with the essential metrics.
- Step 3: Adjust forecasts and assumptions in the editable yellow cells (WACC, growth, margins).
- Step 4: Instantly see updated results, including Hubei Yihua Chemical Industry Co., Ltd.'s (000422SZ) intrinsic value.
- Step 5: Use the outputs to make informed investment decisions or create reports.
Why Choose This Calculator for Hubei Yihua Chemical Industry Co., Ltd. (000422SZ)?
- Reliable Data: Authentic financial information on Hubei Yihua ensures trustworthy valuation outcomes.
- Customizable Options: Modify essential parameters such as growth estimates, WACC, and tax rates to align with your forecasts.
- Efficiency Boost: Pre-configured calculations save you the hassle of starting from the beginning.
- Expert-Level Tool: Tailored for investors, analysts, and consultants looking for precision.
- User-Friendly Interface: Designed with an intuitive layout and guided instructions, making it accessible for everyone.
Who Can Benefit from This Product?
- Institutional Investors: Develop comprehensive and reliable valuation models for evaluating their investment in Hubei Yihua Chemical Industry Co., Ltd. (000422SZ).
- Corporate Finance Departments: Explore various valuation scenarios to inform internal decision-making and strategy for Hubei Yihua Chemical Industry Co., Ltd. (000422SZ).
- Financial Consultants and Advisors: Equip clients with precise valuation insights related to Hubei Yihua Chemical Industry Co., Ltd. (000422SZ).
- Students and Educators: Utilize actual market data to enhance financial modeling skills and teaching practices around Hubei Yihua Chemical Industry Co., Ltd. (000422SZ).
- Chemical Industry Enthusiasts: Gain a deeper understanding of how companies like Hubei Yihua Chemical Industry Co., Ltd. (000422SZ) are valued in the marketplace.
What the Template Contains for Hubei Yihua Chemical Industry Co., Ltd. (000422SZ)
- Historical Data: Contains Hubei Yihua's previous financial performance and baseline projections.
- DCF and Levered DCF Models: Comprehensive templates for assessing Hubei Yihua's intrinsic value.
- WACC Sheet: Pre-calculated metrics for Weighted Average Cost of Capital.
- Editable Inputs: Adjust essential factors such as growth rates, EBITDA %, and CAPEX estimates.
- Quarterly and Annual Statements: A thorough analysis of Hubei Yihua's financial data.
- Interactive Dashboard: Dynamic visualization of valuation outcomes and forecasts.
Disclaimer
All information, articles, and product details provided on this website are for general informational and educational purposes only. We do not claim any ownership over, nor do we intend to infringe upon, any trademarks, copyrights, logos, brand names, or other intellectual property mentioned or depicted on this site. Such intellectual property remains the property of its respective owners, and any references here are made solely for identification or informational purposes, without implying any affiliation, endorsement, or partnership.
We make no representations or warranties, express or implied, regarding the accuracy, completeness, or suitability of any content or products presented. Nothing on this website should be construed as legal, tax, investment, financial, medical, or other professional advice. In addition, no part of this site—including articles or product references—constitutes a solicitation, recommendation, endorsement, advertisement, or offer to buy or sell any securities, franchises, or other financial instruments, particularly in jurisdictions where such activity would be unlawful.
All content is of a general nature and may not address the specific circumstances of any individual or entity. It is not a substitute for professional advice or services. Any actions you take based on the information provided here are strictly at your own risk. You accept full responsibility for any decisions or outcomes arising from your use of this website and agree to release us from any liability in connection with your use of, or reliance upon, the content or products found herein.