
|
Wharf Limited (0004.HK) DCF Valuation |
Fully Editable: Tailor To Your Needs In Excel Or Sheets
Professional Design: Trusted, Industry-Standard Templates
Investor-Approved Valuation Models
MAC/PC Compatible, Fully Unlocked
No Expertise Is Needed; Easy To Follow
Wharf (Holdings) Limited (0004.HK) Bundle
Designed for accuracy, our Wharf (Holdings) Limited (0004HK) DCF Calculator enables you to evaluate Wharf (Holdings) Limited's valuation using real-world financial data, offering complete flexibility to modify all essential parameters for improved projections.
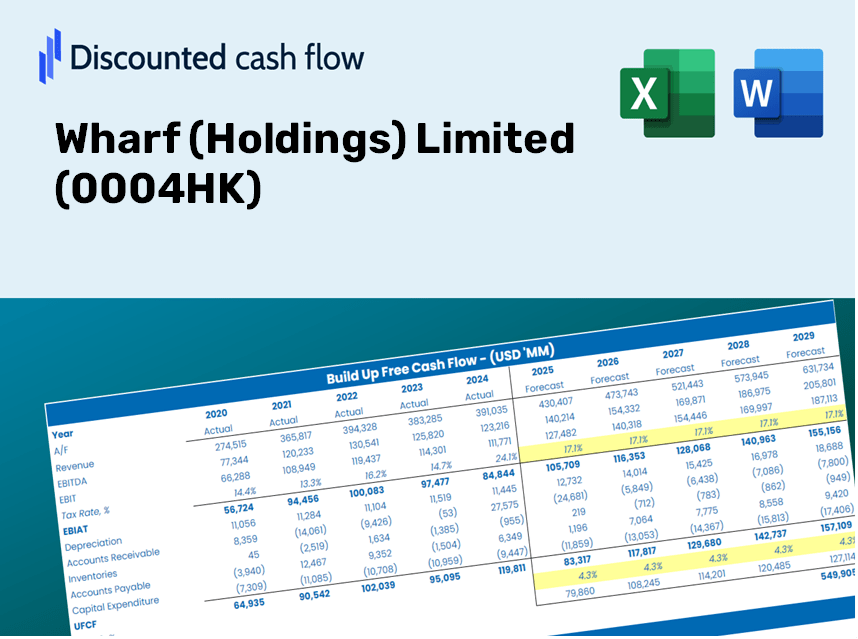
Discounted Cash Flow (DCF) - (USD MM)
| Year | AY1 2020 |
AY2 2021 |
AY3 2022 |
AY4 2023 |
AY5 2024 |
FY1 2025 |
FY2 2026 |
FY3 2027 |
FY4 2028 |
FY5 2029 |
|---|---|---|---|---|---|---|---|---|---|---|
| Revenue | 20,997.0 | 22,378.0 | 18,064.0 | 18,950.0 | 12,115.0 | 10,786.5 | 9,603.6 | 8,550.5 | 7,612.8 | 6,778.0 |
| Revenue Growth, % | 0 | 6.58 | -19.28 | 4.9 | -36.07 | -10.97 | -10.97 | -10.97 | -10.97 | -10.97 |
| EBITDA | 8,964.0 | 5,954.0 | 2,550.0 | 3,750.0 | -5,286.0 | 1,285.1 | 1,144.2 | 1,018.7 | 907.0 | 807.6 |
| EBITDA, % | 42.69 | 26.61 | 14.12 | 19.79 | -43.63 | 11.91 | 11.91 | 11.91 | 11.91 | 11.91 |
| Depreciation | 724.0 | 754.0 | 717.0 | 706.0 | 708.0 | 439.1 | 391.0 | 348.1 | 309.9 | 275.9 |
| Depreciation, % | 3.45 | 3.37 | 3.97 | 3.73 | 5.84 | 4.07 | 4.07 | 4.07 | 4.07 | 4.07 |
| EBIT | 8,240.0 | 5,200.0 | 1,833.0 | 3,044.0 | -5,994.0 | 846.0 | 753.2 | 670.6 | 597.1 | 531.6 |
| EBIT, % | 39.24 | 23.24 | 10.15 | 16.06 | -49.48 | 7.84 | 7.84 | 7.84 | 7.84 | 7.84 |
| Total Cash | 16,668.0 | 23,559.0 | 14,648.0 | 11,593.0 | 9,718.0 | 8,669.4 | 7,718.7 | 6,872.2 | 6,118.6 | 5,447.6 |
| Total Cash, percent | .0 | .0 | .0 | .0 | .0 | .0 | .0 | .0 | .0 | .0 |
| Account Receivables | 13,895.0 | 1,886.0 | 1,755.0 | 1,618.0 | 1,507.0 | 2,271.6 | 2,022.5 | 1,800.7 | 1,603.2 | 1,427.4 |
| Account Receivables, % | 66.18 | 8.43 | 9.72 | 8.54 | 12.44 | 21.06 | 21.06 | 21.06 | 21.06 | 21.06 |
| Inventories | 42,396.0 | 48,485.0 | 42,986.0 | 37,196.0 | 35,755.0 | 10,786.5 | 9,603.6 | 8,550.5 | 7,612.8 | 6,778.0 |
| Inventories, % | 201.91 | 216.66 | 237.97 | 196.28 | 295.13 | 100 | 100 | 100 | 100 | 100 |
| Accounts Payable | 864.0 | 950.0 | 793.0 | 883.0 | 836.0 | 524.4 | 466.9 | 415.7 | 370.1 | 329.5 |
| Accounts Payable, % | 4.11 | 4.25 | 4.39 | 4.66 | 6.9 | 4.86 | 4.86 | 4.86 | 4.86 | 4.86 |
| Capital Expenditure | -380.0 | -473.0 | -348.0 | -577.0 | -231.0 | -233.0 | -207.5 | -184.7 | -164.5 | -146.4 |
| Capital Expenditure, % | -1.81 | -2.11 | -1.93 | -3.04 | -1.91 | -2.16 | -2.16 | -2.16 | -2.16 | -2.16 |
| Tax Rate, % | 48.96 | 48.96 | 48.96 | 48.96 | 48.96 | 48.96 | 48.96 | 48.96 | 48.96 | 48.96 |
| EBITAT | 3,342.0 | 3,388.4 | -13,828.6 | 1,310.5 | -3,059.6 | 338.1 | 301.0 | 268.0 | 238.6 | 212.4 |
| Depreciation | ||||||||||
| Changes in Account Receivables | ||||||||||
| Changes in Inventories | ||||||||||
| Changes in Accounts Payable | ||||||||||
| Capital Expenditure | ||||||||||
| UFCF | -51,741.0 | 9,675.4 | -7,986.6 | 7,456.5 | -1,077.6 | 24,436.6 | 1,859.0 | 1,655.1 | 1,473.6 | 1,312.0 |
| WACC, % | 4.34 | 4.54 | 4.02 | 4.36 | 4.43 | 4.34 | 4.34 | 4.34 | 4.34 | 4.34 |
| PV UFCF | ||||||||||
| SUM PV UFCF | 28,889.0 | |||||||||
| Long Term Growth Rate, % | 2.00 | |||||||||
| Free cash flow (T + 1) | 1,338 | |||||||||
| Terminal Value | 57,188 | |||||||||
| Present Terminal Value | 46,244 | |||||||||
| Enterprise Value | 75,133 | |||||||||
| Net Debt | 13,544 | |||||||||
| Equity Value | 61,589 | |||||||||
| Diluted Shares Outstanding, MM | 3,056 | |||||||||
| Equity Value Per Share | 20.15 |
What You Will Receive
- Authentic Wharf (Holdings) Limited Financials: Features both historical data and forecasts for precise valuation.
- Customizable Inputs: Adjust WACC, tax rates, revenue growth, and capital expenditures as needed.
- Automated Calculations: Intrinsic value and NPV are computed in real-time.
- Scenario Analysis: Explore various scenarios to assess Wharf’s future performance.
- User-Friendly Design: Designed for professionals while remaining easy to understand for beginners.
Key Features
- Real-Life Wharf (Holdings) Data: Pre-filled with Wharf (Holdings) Limited's historical financials and forward-looking projections.
- Fully Customizable Inputs: Modify revenue growth, profit margins, WACC, tax rates, and capital expenditures to suit your analysis.
- Dynamic Valuation Model: Automatically updates Net Present Value (NPV) and intrinsic value based on your customized inputs.
- Scenario Testing: Generate multiple forecasting scenarios to explore various valuation outcomes.
- User-Friendly Design: Intuitive and structured interface, suitable for both professionals and novices.
How It Functions
- Step 1: Download the Excel file.
- Step 2: Examine the pre-filled Wharf (Holdings) Limited (0004HK) data (historical and projected).
- Step 3: Modify key assumptions (yellow cells) according to your analysis.
- Step 4: Observe automatic updates reflecting Wharf (Holdings) Limited's (0004HK) intrinsic value.
- Step 5: Utilize the results for investment decisions or reporting purposes.
Why Opt for This Calculator?
- All-in-One Solution: Combines DCF, WACC, and financial ratio analyses for thorough evaluations.
- Flexible Inputs: Modify the yellow-highlighted cells to explore different scenarios.
- In-Depth Analysis: Automatically computes Wharf (Holdings) Limited’s intrinsic value and Net Present Value.
- Preloaded Information: Historical and projected data provide reliable foundations for analysis.
- Top-tier Quality: Perfect for financial analysts, investors, and business advisors.
Who Can Benefit from This Product?
- Investors: Evaluate Wharf (Holdings) Limited’s (0004HK) valuation prior to making stock transactions.
- CFOs and Financial Analysts: Optimize valuation workflows and assess financial forecasts.
- Startup Founders: Understand the valuation methods applied to large public entities like Wharf (Holdings) Limited.
- Consultants: Create detailed valuation reports to present to clients.
- Students and Educators: Utilize real-market data to enhance learning and practice in valuation methods.
Contents of the Template
- Preloaded Wharf Data: Historical and projected financial metrics, including revenue, EBIT, and capital expenditures.
- DCF and WACC Models: Professional-grade sheets designed for computing intrinsic value and Weighted Average Cost of Capital.
- Editable Inputs: Yellow-highlighted cells for customizing revenue growth, tax rates, and discount rates.
- Financial Statements: Detailed annual and quarterly financials for in-depth analysis.
- Key Ratios: Profitability, leverage, and efficiency ratios for performance evaluation.
- Dashboard and Charts: Visual representations of valuation outcomes and underlying assumptions.
Disclaimer
All information, articles, and product details provided on this website are for general informational and educational purposes only. We do not claim any ownership over, nor do we intend to infringe upon, any trademarks, copyrights, logos, brand names, or other intellectual property mentioned or depicted on this site. Such intellectual property remains the property of its respective owners, and any references here are made solely for identification or informational purposes, without implying any affiliation, endorsement, or partnership.
We make no representations or warranties, express or implied, regarding the accuracy, completeness, or suitability of any content or products presented. Nothing on this website should be construed as legal, tax, investment, financial, medical, or other professional advice. In addition, no part of this site—including articles or product references—constitutes a solicitation, recommendation, endorsement, advertisement, or offer to buy or sell any securities, franchises, or other financial instruments, particularly in jurisdictions where such activity would be unlawful.
All content is of a general nature and may not address the specific circumstances of any individual or entity. It is not a substitute for professional advice or services. Any actions you take based on the information provided here are strictly at your own risk. You accept full responsibility for any decisions or outcomes arising from your use of this website and agree to release us from any liability in connection with your use of, or reliance upon, the content or products found herein.