
|
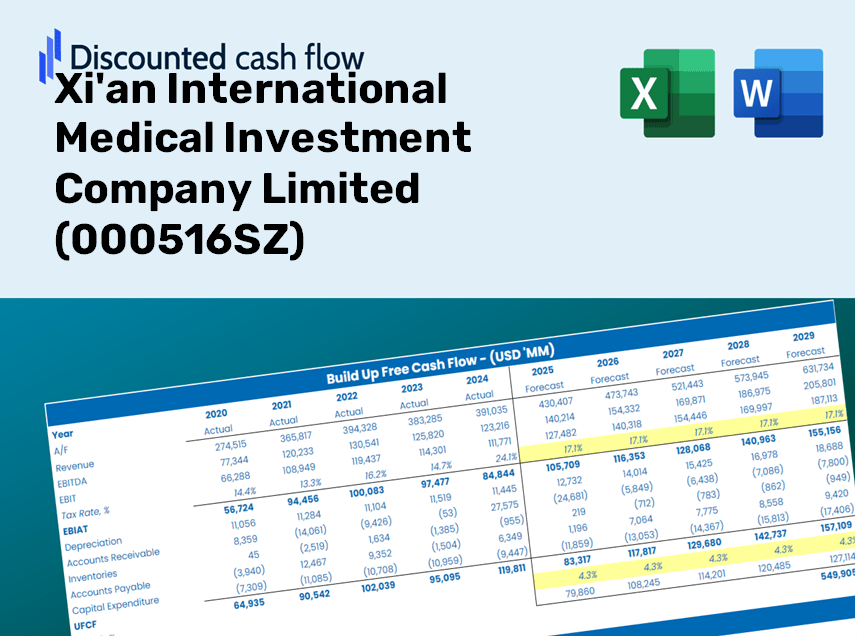
Xi'an International Medical Investment Company Limited (000516.SZ) DCF Valuation |
Fully Editable: Tailor To Your Needs In Excel Or Sheets
Professional Design: Trusted, Industry-Standard Templates
Investor-Approved Valuation Models
MAC/PC Compatible, Fully Unlocked
No Expertise Is Needed; Easy To Follow
Xi'an International Medical Investment Company Limited (000516.SZ) Bundle
Looking to determine the intrinsic value of Xi'an International Medical Investment Company Limited? Our (000516SZ) DCF Calculator integrates real-world data with comprehensive customization features, enabling you to refine your projections and enhance your investment choices.
Benefits You Will Receive
- Comprehensive 000516SZ Financial Data: Access both historical and projected figures for precise valuation.
- Customizable Parameters: Adjust WACC, tax rates, revenue growth, and capital expenditures as needed.
- Instant Calculations: Intrinsic value and NPV are computed in real-time.
- Scenario Planning: Explore various scenarios to assess the future trajectory of Xi'an International Medical Investment Company Limited.
- User-Friendly Interface: Designed for professionals, yet easy enough for newcomers to navigate.
Key Features
- 🔍 Real-Life 000516SZ Financials: Pre-filled historical and projected data for Xi'an International Medical Investment Company Limited.
- ✏️ Fully Customizable Inputs: Adjust all critical parameters (yellow cells) such as WACC, growth %, and tax rates.
- 📊 Professional DCF Valuation: Built-in formulas calculate the intrinsic value of Xi'an International Medical Investment Company Limited using the Discounted Cash Flow method.
- ⚡ Instant Results: Visualize the valuation of Xi'an International Medical Investment Company Limited instantly after making changes.
- Scenario Analysis: Test and compare outcomes for various financial assumptions side-by-side.
How It Operates
- 1. Access the Template: Download and open the Excel file featuring preloaded data for Xi'an International Medical Investment Company Limited (000516SZ).
- 2. Adjust Assumptions: Modify key inputs such as growth rates, WACC, and capital expenditures to fit your analysis.
- 3. View Results in Real-Time: The DCF model automatically calculates intrinsic value and NPV as you update inputs.
- 4. Evaluate Scenarios: Conduct comparisons of various forecasts to assess different valuation possibilities.
- 5. Utilize with Assurance: Share professional valuation insights to back your investment decisions confidently.
Why Select This Calculator from Xi'an International Medical Investment Company Limited (000516SZ)?
- Time-saving: Skip the hassle of building a DCF model from the ground up – it’s ready for immediate use.
- Enhanced Accuracy: Trustworthy financial data and formulas help minimize valuation errors.
- Completely Customizable: Adjust the model to align with your specific assumptions and forecasts.
- Simple to Understand: Intuitive charts and outputs make interpreting results straightforward.
- Endorsed by Professionals: Created for experts who prioritize both precision and user-friendliness.
Who Can Benefit from This Product?
- Professional Investors: Develop comprehensive and accurate valuation models for portfolio assessments related to Xi'an International Medical Investment Company Limited (000516SZ).
- Corporate Finance Teams: Evaluate valuation scenarios to inform strategic decisions within the organization.
- Consultants and Advisors: Equip clients with precise valuation insights for Xi'an International Medical Investment Company Limited (000516SZ).
- Students and Educators: Leverage real-world financial data for hands-on learning and teaching in financial modeling.
- Healthcare Sector Enthusiasts: Gain insights into how healthcare companies like Xi'an International Medical Investment Company Limited (000516SZ) are valued in the marketplace.
Overview of the Template's Features
- In-Depth DCF Model: Fully editable template featuring comprehensive valuation calculations.
- Accurate Financial Data: Xi'an International Medical Investment Company Limited's (000516SZ) historical and projected financials included for thorough analysis.
- Adjustable Variables: Modify WACC, growth rates, and tax assumptions to explore different scenarios.
- Detailed Financial Statements: Complete annual and quarterly breakdowns for enhanced insights.
- Essential Ratios: Integrated analysis of profitability, efficiency, and leverage metrics.
- User-Friendly Dashboard: Visual charts and tables providing clear, actionable results.
Disclaimer
All information, articles, and product details provided on this website are for general informational and educational purposes only. We do not claim any ownership over, nor do we intend to infringe upon, any trademarks, copyrights, logos, brand names, or other intellectual property mentioned or depicted on this site. Such intellectual property remains the property of its respective owners, and any references here are made solely for identification or informational purposes, without implying any affiliation, endorsement, or partnership.
We make no representations or warranties, express or implied, regarding the accuracy, completeness, or suitability of any content or products presented. Nothing on this website should be construed as legal, tax, investment, financial, medical, or other professional advice. In addition, no part of this site—including articles or product references—constitutes a solicitation, recommendation, endorsement, advertisement, or offer to buy or sell any securities, franchises, or other financial instruments, particularly in jurisdictions where such activity would be unlawful.
All content is of a general nature and may not address the specific circumstances of any individual or entity. It is not a substitute for professional advice or services. Any actions you take based on the information provided here are strictly at your own risk. You accept full responsibility for any decisions or outcomes arising from your use of this website and agree to release us from any liability in connection with your use of, or reliance upon, the content or products found herein.