
|
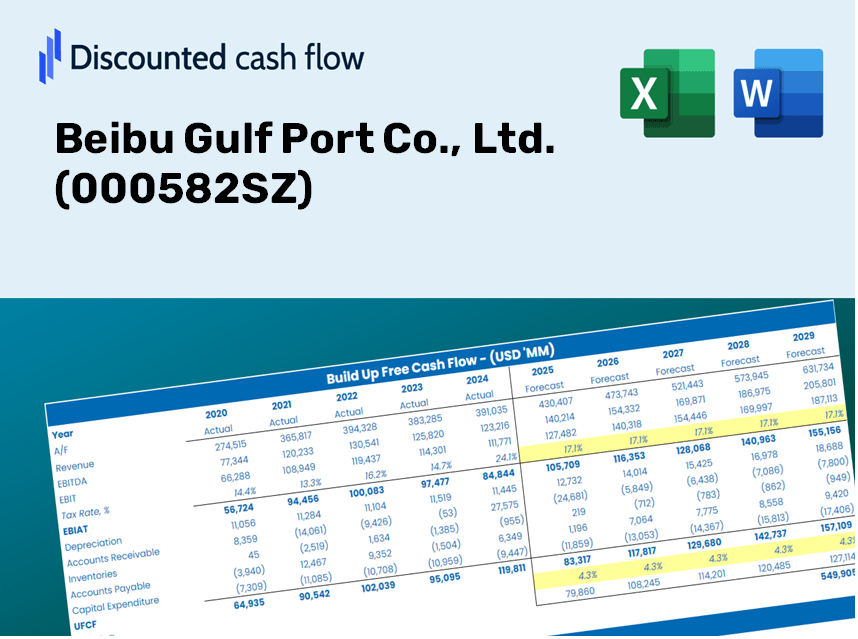
Beibu Gulf Port Co., Ltd. (000582.SZ) DCF Valuation |
Fully Editable: Tailor To Your Needs In Excel Or Sheets
Professional Design: Trusted, Industry-Standard Templates
Investor-Approved Valuation Models
MAC/PC Compatible, Fully Unlocked
No Expertise Is Needed; Easy To Follow
Beibu Gulf Port Co., Ltd. (000582.SZ) Bundle
Looking to determine the intrinsic value of Beibu Gulf Port Co., Ltd.? Our (000582SZ) DCF Calculator integrates real-world data with comprehensive customization features, allowing you to refine your forecasts and enhance your investment strategies.
Discounted Cash Flow (DCF) - (USD MM)
| Year | AY1 2020 |
AY2 2021 |
AY3 2022 |
AY4 2023 |
AY5 2024 |
FY1 2025 |
FY2 2026 |
FY3 2027 |
FY4 2028 |
FY5 2029 |
|---|---|---|---|---|---|---|---|---|---|---|
| Revenue | 5,362.6 | 5,907.9 | 6,378.9 | 6,949.6 | 7,003.3 | 7,491.0 | 8,012.8 | 8,570.9 | 9,167.9 | 9,806.4 |
| Revenue Growth, % | 0 | 10.17 | 7.97 | 8.95 | 0.77196 | 6.97 | 6.97 | 6.97 | 6.97 | 6.97 |
| EBITDA | 2,352.1 | 2,298.8 | 2,528.9 | 2,834.5 | 2,812.1 | 3,046.8 | 3,259.0 | 3,486.0 | 3,728.8 | 3,988.5 |
| EBITDA, % | 43.86 | 38.91 | 39.65 | 40.79 | 40.15 | 40.67 | 40.67 | 40.67 | 40.67 | 40.67 |
| Depreciation | 766.6 | 729.9 | 920.1 | 1,114.6 | 1,253.6 | 1,123.9 | 1,202.1 | 1,285.9 | 1,375.4 | 1,471.2 |
| Depreciation, % | 14.3 | 12.35 | 14.42 | 16.04 | 17.9 | 15 | 15 | 15 | 15 | 15 |
| EBIT | 1,585.5 | 1,568.9 | 1,608.9 | 1,720.0 | 1,558.5 | 1,922.9 | 2,056.8 | 2,200.1 | 2,353.3 | 2,517.3 |
| EBIT, % | 29.57 | 26.56 | 25.22 | 24.75 | 22.25 | 25.67 | 25.67 | 25.67 | 25.67 | 25.67 |
| Total Cash | 2,612.6 | 3,590.5 | 2,144.5 | 2,134.7 | 3,295.8 | 3,309.4 | 3,539.9 | 3,786.5 | 4,050.2 | 4,332.3 |
| Total Cash, percent | .0 | .0 | .0 | .0 | .0 | .0 | .0 | .0 | .0 | .0 |
| Account Receivables | 444.0 | 894.9 | 708.0 | 791.7 | 1,169.8 | 938.2 | 1,003.5 | 1,073.4 | 1,148.2 | 1,228.2 |
| Account Receivables, % | 8.28 | 15.15 | 11.1 | 11.39 | 16.7 | 12.52 | 12.52 | 12.52 | 12.52 | 12.52 |
| Inventories | .0 | .0 | 46.9 | 42.2 | 41.9 | 29.1 | 31.1 | 33.3 | 35.6 | 38.1 |
| Inventories, % | 0 | 0 | 0.73497 | 0.60697 | 0.5982 | 0.38803 | 0.38803 | 0.38803 | 0.38803 | 0.38803 |
| Accounts Payable | 1,036.4 | 1,920.9 | 2,285.4 | 2,104.4 | 2,339.7 | 2,267.7 | 2,425.6 | 2,594.5 | 2,775.3 | 2,968.6 |
| Accounts Payable, % | 19.33 | 32.51 | 35.83 | 30.28 | 33.41 | 30.27 | 30.27 | 30.27 | 30.27 | 30.27 |
| Capital Expenditure | -1,489.6 | -3,723.6 | -4,478.6 | -3,025.9 | -1,862.6 | -3,463.2 | -3,704.4 | -3,962.4 | -4,238.4 | -4,533.6 |
| Capital Expenditure, % | -27.78 | -63.03 | -70.21 | -43.54 | -26.6 | -46.23 | -46.23 | -46.23 | -46.23 | -46.23 |
| Tax Rate, % | 24.54 | 24.54 | 24.54 | 24.54 | 24.54 | 24.54 | 24.54 | 24.54 | 24.54 | 24.54 |
| EBITAT | 1,251.1 | 1,148.0 | 1,178.9 | 1,284.5 | 1,176.0 | 1,444.1 | 1,544.7 | 1,652.2 | 1,767.3 | 1,890.4 |
| Depreciation | ||||||||||
| Changes in Account Receivables | ||||||||||
| Changes in Inventories | ||||||||||
| Changes in Accounts Payable | ||||||||||
| Capital Expenditure | ||||||||||
| UFCF | 1,120.5 | -1,412.1 | -1,875.2 | -886.8 | 424.4 | -722.8 | -867.0 | -927.4 | -992.0 | -1,061.1 |
| WACC, % | 4.52 | 4.45 | 4.45 | 4.47 | 4.48 | 4.47 | 4.47 | 4.47 | 4.47 | 4.47 |
| PV UFCF | ||||||||||
| SUM PV UFCF | -3,985.0 | |||||||||
| Long Term Growth Rate, % | 0.50 | |||||||||
| Free cash flow (T + 1) | -1,066 | |||||||||
| Terminal Value | -26,853 | |||||||||
| Present Terminal Value | -21,578 | |||||||||
| Enterprise Value | -25,563 | |||||||||
| Net Debt | 6,083 | |||||||||
| Equity Value | -31,647 | |||||||||
| Diluted Shares Outstanding, MM | 2,277 | |||||||||
| Equity Value Per Share | -13.90 |
What You Will Receive
- Authentic Beibu Gulf Port Data: Comprehensive financials – including revenue and EBIT – sourced from actual and forecasted figures.
- Complete Customization: Modify all essential parameters (highlighted cells) such as WACC, growth percentages, and tax rates.
- Immediate Valuation Adjustments: Automatic recalibrations to assess how changes affect the fair value of Beibu Gulf Port Co., Ltd. (000582SZ).
- Flexible Excel Template: Designed for swift modifications, scenario analysis, and thorough projections.
- Efficient and Accurate: Avoid the hassle of constructing models from scratch while ensuring precision and adaptability.
Key Features
- 🔍 Real-Life Beibu Gulf Port Financials: Pre-filled historical and projected data for Beibu Gulf Port Co., Ltd. (000582SZ).
- ✏️ Fully Customizable Inputs: Modify all essential parameters (yellow cells) such as WACC, growth %, and tax rates.
- 📊 Professional DCF Valuation: Integrated formulas assess Beibu Gulf Port's intrinsic value using the Discounted Cash Flow method.
- ⚡ Instant Results: Visualize Beibu Gulf Port's valuation immediately after making adjustments.
- Scenario Analysis: Evaluate and compare outcomes for various financial scenarios side-by-side.
How It Operates
- Step 1: Download the Excel template.
- Step 2: Examine Beibu Gulf Port Co., Ltd.'s pre-filled financial data and projections.
- Step 3: Adjust key variables such as revenue growth, WACC, and tax rates (highlighted cells).
- Step 4: Observe the DCF model refresh in real-time as you update your assumptions.
- Step 5: Review the results and leverage them for your investment strategies.
Why Choose Beibu Gulf Port Co., Ltd. (000582SZ) Calculator?
- Time-Efficient: Skip the hassle of building a DCF model from scratch – it’s ready for immediate use.
- Enhanced Precision: Dependable financial data and formulas minimize valuation errors.
- Fully Adjustable: Customize the model to align with your specific assumptions and forecasts.
- User-Friendly: Intuitive charts and outputs simplify the analysis of results.
- Endorsed by Professionals: Crafted for industry experts who prioritize accuracy and functionality.
Who Should Consider Utilizing This Product?
- Investors: Assess Beibu Gulf Port Co., Ltd.'s (000582SZ) valuation prior to making investment decisions.
- CFOs and Financial Analysts: Enhance the efficiency of valuation processes and evaluate financial projections.
- Startup Founders: Understand the valuation methods applied to leading companies like Beibu Gulf Port Co., Ltd. (000582SZ).
- Consultants: Produce comprehensive valuation reports for your clients regarding Beibu Gulf Port Co., Ltd. (000582SZ).
- Students and Educators: Utilize current data to practice and impart valuation skills effectively.
Contents of the Template
- Historical Data: Features Beibu Gulf Port Co., Ltd.'s past financial performance and foundational forecasts.
- DCF and Levered DCF Models: Comprehensive templates designed to assess the intrinsic value of Beibu Gulf Port Co., Ltd.
- WACC Sheet: Pre-configured calculations for the Weighted Average Cost of Capital.
- Editable Inputs: Customize essential parameters such as growth rates, EBITDA margins, and CAPEX estimates.
- Quarterly and Annual Statements: An in-depth analysis of Beibu Gulf Port Co., Ltd.'s financial data.
- Interactive Dashboard: Dynamically visualize valuation outcomes and future projections.
Disclaimer
All information, articles, and product details provided on this website are for general informational and educational purposes only. We do not claim any ownership over, nor do we intend to infringe upon, any trademarks, copyrights, logos, brand names, or other intellectual property mentioned or depicted on this site. Such intellectual property remains the property of its respective owners, and any references here are made solely for identification or informational purposes, without implying any affiliation, endorsement, or partnership.
We make no representations or warranties, express or implied, regarding the accuracy, completeness, or suitability of any content or products presented. Nothing on this website should be construed as legal, tax, investment, financial, medical, or other professional advice. In addition, no part of this site—including articles or product references—constitutes a solicitation, recommendation, endorsement, advertisement, or offer to buy or sell any securities, franchises, or other financial instruments, particularly in jurisdictions where such activity would be unlawful.
All content is of a general nature and may not address the specific circumstances of any individual or entity. It is not a substitute for professional advice or services. Any actions you take based on the information provided here are strictly at your own risk. You accept full responsibility for any decisions or outcomes arising from your use of this website and agree to release us from any liability in connection with your use of, or reliance upon, the content or products found herein.