
|
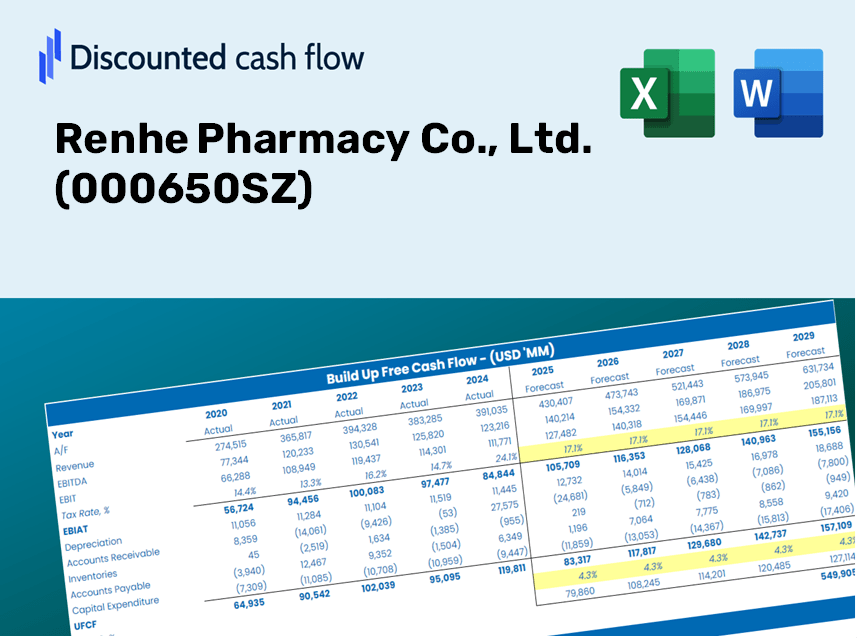
Renhe Pharmacy Co., Ltd. (000650.SZ) DCF Valuation |
Fully Editable: Tailor To Your Needs In Excel Or Sheets
Professional Design: Trusted, Industry-Standard Templates
Investor-Approved Valuation Models
MAC/PC Compatible, Fully Unlocked
No Expertise Is Needed; Easy To Follow
Renhe Pharmacy Co., Ltd. (000650.SZ) Bundle
Engineered for accuracy, our (000650SZ) DCF Calculator enables you to evaluate Renhe Pharmacy Co., Ltd. valuation using real-world financial data, while providing complete flexibility to modify all essential parameters for improved projections.
Discounted Cash Flow (DCF) - (USD MM)
| Year | AY1 2020 |
AY2 2021 |
AY3 2022 |
AY4 2023 |
AY5 2024 |
FY1 2025 |
FY2 2026 |
FY3 2027 |
FY4 2028 |
FY5 2029 |
|---|---|---|---|---|---|---|---|---|---|---|
| Revenue | 4,277.8 | 4,935.8 | 5,153.2 | 5,032.1 | 4,074.9 | 4,058.7 | 4,042.7 | 4,026.6 | 4,010.7 | 3,994.8 |
| Revenue Growth, % | 0 | 15.38 | 4.41 | -2.35 | -19.02 | -0.3964 | -0.3964 | -0.3964 | -0.3964 | -0.3964 |
| EBITDA | 873.9 | 1,005.6 | 990.7 | 1,078.7 | 787.0 | 818.1 | 814.8 | 811.6 | 808.4 | 805.2 |
| EBITDA, % | 20.43 | 20.37 | 19.23 | 21.44 | 19.31 | 20.16 | 20.16 | 20.16 | 20.16 | 20.16 |
| Depreciation | 82.2 | 83.1 | 111.8 | 134.9 | 115.8 | 91.7 | 91.3 | 91.0 | 90.6 | 90.3 |
| Depreciation, % | 1.92 | 1.68 | 2.17 | 2.68 | 2.84 | 2.26 | 2.26 | 2.26 | 2.26 | 2.26 |
| EBIT | 791.7 | 922.5 | 879.0 | 943.8 | 671.3 | 726.4 | 723.5 | 720.6 | 717.8 | 714.9 |
| EBIT, % | 18.51 | 18.69 | 17.06 | 18.76 | 16.47 | 17.9 | 17.9 | 17.9 | 17.9 | 17.9 |
| Total Cash | 2,886.5 | 2,676.0 | 3,242.3 | 3,534.5 | 3,345.7 | 2,735.2 | 2,724.4 | 2,713.6 | 2,702.8 | 2,692.1 |
| Total Cash, percent | .0 | .0 | .0 | .0 | .0 | .0 | .0 | .0 | .0 | .0 |
| Account Receivables | 484.5 | 539.8 | 486.4 | 538.0 | 472.6 | 438.3 | 436.5 | 434.8 | 433.1 | 431.4 |
| Account Receivables, % | 11.33 | 10.94 | 9.44 | 10.69 | 11.6 | 10.8 | 10.8 | 10.8 | 10.8 | 10.8 |
| Inventories | 465.3 | 601.4 | 457.7 | 446.6 | 486.9 | 428.3 | 426.6 | 425.0 | 423.3 | 421.6 |
| Inventories, % | 10.88 | 12.18 | 8.88 | 8.87 | 11.95 | 10.55 | 10.55 | 10.55 | 10.55 | 10.55 |
| Accounts Payable | 162.9 | 176.1 | 199.6 | 123.5 | 132.1 | 137.6 | 137.0 | 136.5 | 135.9 | 135.4 |
| Accounts Payable, % | 3.81 | 3.57 | 3.87 | 2.45 | 3.24 | 3.39 | 3.39 | 3.39 | 3.39 | 3.39 |
| Capital Expenditure | -218.2 | -499.8 | -221.1 | -186.5 | -285.7 | -245.4 | -244.5 | -243.5 | -242.5 | -241.6 |
| Capital Expenditure, % | -5.1 | -10.13 | -4.29 | -3.71 | -7.01 | -6.05 | -6.05 | -6.05 | -6.05 | -6.05 |
| Tax Rate, % | 37.79 | 37.79 | 37.79 | 37.79 | 37.79 | 37.79 | 37.79 | 37.79 | 37.79 | 37.79 |
| EBITAT | 528.7 | 593.1 | 529.5 | 595.6 | 417.6 | 460.0 | 458.2 | 456.4 | 454.5 | 452.7 |
| Depreciation | ||||||||||
| Changes in Account Receivables | ||||||||||
| Changes in Inventories | ||||||||||
| Changes in Accounts Payable | ||||||||||
| Capital Expenditure | ||||||||||
| UFCF | -394.2 | -1.8 | 640.7 | 427.4 | 281.3 | 404.7 | 307.9 | 306.7 | 305.5 | 304.3 |
| WACC, % | 6.15 | 6.15 | 6.15 | 6.15 | 6.15 | 6.15 | 6.15 | 6.15 | 6.15 | 6.15 |
| PV UFCF | ||||||||||
| SUM PV UFCF | 1,377.3 | |||||||||
| Long Term Growth Rate, % | 3.00 | |||||||||
| Free cash flow (T + 1) | 313 | |||||||||
| Terminal Value | 9,944 | |||||||||
| Present Terminal Value | 7,378 | |||||||||
| Enterprise Value | 8,755 | |||||||||
| Net Debt | -2,327 | |||||||||
| Equity Value | 11,082 | |||||||||
| Diluted Shares Outstanding, MM | 1,384 | |||||||||
| Equity Value Per Share | 8.00 |
What You Will Receive
- Comprehensive Renhe Pharmacy Data: Access historical and projected financial metrics for precise valuation.
- Customizable Parameters: Adjust WACC, tax percentages, revenue growth rates, and capital investments.
- Automated Calculations: Intrinsic value and NPV are computed in real-time.
- Scenario Testing: Explore various scenarios to assess Renhe Pharmacy's future prospects.
- User-Friendly Interface: Designed for experts while remaining approachable for newcomers.
Key Features
- Customizable Forecast Inputs: Adjust essential metrics such as revenue growth, EBITDA %, and capital investments.
- Instant DCF Valuation: Quickly calculates intrinsic value, NPV, and additional financial outputs.
- High-Precision Accuracy: Leverages Renhe Pharmacy's actual financial data for credible valuation results.
- Effortless Scenario Analysis: Explore various assumptions and easily compare results.
- Efficiency Booster: Skip the complex process of crafting detailed valuation models from the ground up.
How It Operates
- 1. Access the Template: Download and open the Excel file containing Renhe Pharmacy Co., Ltd.’s preloaded data.
- 2. Modify Assumptions: Adjust essential inputs such as growth rates, WACC, and capital expenditures.
- 3. See Immediate Results: The DCF model automatically calculates the intrinsic value and NPV.
- 4. Explore Scenarios: Evaluate various forecasts to understand different valuation outcomes.
- 5. Utilize with Assurance: Deliver professional valuation insights to reinforce your decision-making.
Why Opt for This Calculator?
- User-Friendly Interface: Perfectly crafted for both newcomers and seasoned users.
- Customizable Inputs: Effortlessly adjust parameters to suit your analytical needs.
- Real-Time Valuation: Instantly observe changes in Renhe Pharmacy Co., Ltd.'s (000650SZ) value as you modify inputs.
- Pre-Loaded Data: Comes with Renhe Pharmacy’s actual financial information for swift assessments.
- Preferred by Experts: A go-to tool for investors and analysts making strategic choices.
Who Can Benefit from Renhe Pharmacy Co., Ltd. (000650SZ)?
- Investors: Make informed choices with a comprehensive assessment tool tailored for the pharmaceutical market.
- Financial Analysts: Streamline your analysis process with a customizable financial model designed for quick insights.
- Consultants: Easily modify the framework for impactful client presentations or detailed reports.
- Pharmacy Enthusiasts: Enhance your knowledge of the pharmaceutical industry through practical case studies.
- Educators and Students: Utilize this resource as an effective teaching aid in pharmaceutical finance courses.
Contents of the Template
- Historical Data: Comprehensive overview of Renhe Pharmacy's past financial performance and baseline forecasts.
- DCF and Levered DCF Models: Detailed templates for assessing the intrinsic value of Renhe Pharmacy [000650SZ].
- WACC Sheet: Built-in calculations for the Weighted Average Cost of Capital specific to Renhe Pharmacy [000650SZ].
- Editable Inputs: Adjust critical drivers such as growth rates, EBITDA percentages, and CAPEX assumptions.
- Quarterly and Annual Statements: Comprehensive breakdown of the financial statements for Renhe Pharmacy [000650SZ].
- Interactive Dashboard: Dynamic visualization of valuation outcomes and future projections.
Disclaimer
All information, articles, and product details provided on this website are for general informational and educational purposes only. We do not claim any ownership over, nor do we intend to infringe upon, any trademarks, copyrights, logos, brand names, or other intellectual property mentioned or depicted on this site. Such intellectual property remains the property of its respective owners, and any references here are made solely for identification or informational purposes, without implying any affiliation, endorsement, or partnership.
We make no representations or warranties, express or implied, regarding the accuracy, completeness, or suitability of any content or products presented. Nothing on this website should be construed as legal, tax, investment, financial, medical, or other professional advice. In addition, no part of this site—including articles or product references—constitutes a solicitation, recommendation, endorsement, advertisement, or offer to buy or sell any securities, franchises, or other financial instruments, particularly in jurisdictions where such activity would be unlawful.
All content is of a general nature and may not address the specific circumstances of any individual or entity. It is not a substitute for professional advice or services. Any actions you take based on the information provided here are strictly at your own risk. You accept full responsibility for any decisions or outcomes arising from your use of this website and agree to release us from any liability in connection with your use of, or reliance upon, the content or products found herein.