
|
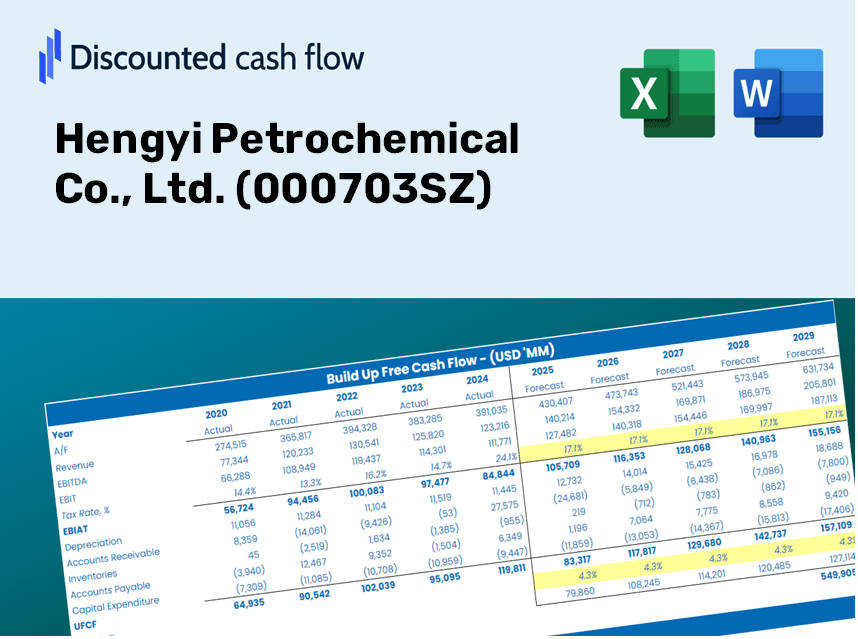
Hengyi Petrochemical Co., Ltd. (000703.SZ) DCF Valuation |
Fully Editable: Tailor To Your Needs In Excel Or Sheets
Professional Design: Trusted, Industry-Standard Templates
Investor-Approved Valuation Models
MAC/PC Compatible, Fully Unlocked
No Expertise Is Needed; Easy To Follow
Hengyi Petrochemical Co., Ltd. (000703.SZ) Bundle
Enhance your investment strategy with the (000703SZ) DCF Calculator! Leverage real Hengyi Petrochemical financial data, adjust growth projections and expenses, and observe how modifications affect the intrinsic value of Hengyi Petrochemical in real time.
Discounted Cash Flow (DCF) - (USD MM)
| Year | AY1 2020 |
AY2 2021 |
AY3 2022 |
AY4 2023 |
AY5 2024 |
FY1 2025 |
FY2 2026 |
FY3 2027 |
FY4 2028 |
FY5 2029 |
|---|---|---|---|---|---|---|---|---|---|---|
| Revenue | 86,429.6 | 129,666.9 | 152,050.3 | 136,148.1 | 125,463.2 | 140,826.8 | 158,071.6 | 177,428.2 | 199,155.0 | 223,542.4 |
| Revenue Growth, % | 0 | 50.03 | 17.26 | -10.46 | -7.85 | 12.25 | 12.25 | 12.25 | 12.25 | 12.25 |
| EBITDA | 6,658.1 | 7,855.3 | 4,319.2 | 6,003.4 | 5,597.2 | 7,174.5 | 8,053.1 | 9,039.2 | 10,146.1 | 11,388.6 |
| EBITDA, % | 7.7 | 6.06 | 2.84 | 4.41 | 4.46 | 5.09 | 5.09 | 5.09 | 5.09 | 5.09 |
| Depreciation | 2,302.5 | 2,826.4 | 3,138.0 | 3,256.3 | 3,113.1 | 3,318.0 | 3,724.3 | 4,180.4 | 4,692.3 | 5,266.9 |
| Depreciation, % | 2.66 | 2.18 | 2.06 | 2.39 | 2.48 | 2.36 | 2.36 | 2.36 | 2.36 | 2.36 |
| EBIT | 4,355.6 | 5,028.9 | 1,181.2 | 2,747.1 | 2,484.1 | 3,856.5 | 4,328.8 | 4,858.8 | 5,453.8 | 6,121.7 |
| EBIT, % | 5.04 | 3.88 | 0.77688 | 2.02 | 1.98 | 2.74 | 2.74 | 2.74 | 2.74 | 2.74 |
| Total Cash | 10,330.9 | 14,711.7 | 17,609.5 | 14,194.2 | 13,246.3 | 15,734.2 | 17,660.9 | 19,823.5 | 22,251.0 | 24,975.7 |
| Total Cash, percent | .0 | .0 | .0 | .0 | .0 | .0 | .0 | .0 | .0 | .0 |
| Account Receivables | 5,076.5 | 7,666.6 | 7,234.1 | 6,317.5 | 6,222.3 | 7,363.4 | 8,265.1 | 9,277.2 | 10,413.2 | 11,688.3 |
| Account Receivables, % | 5.87 | 5.91 | 4.76 | 4.64 | 4.96 | 5.23 | 5.23 | 5.23 | 5.23 | 5.23 |
| Inventories | 9,650.9 | 12,100.4 | 14,083.5 | 13,060.2 | 12,407.4 | 13,869.3 | 15,567.6 | 17,474.0 | 19,613.7 | 22,015.5 |
| Inventories, % | 11.17 | 9.33 | 9.26 | 9.59 | 9.89 | 9.85 | 9.85 | 9.85 | 9.85 | 9.85 |
| Accounts Payable | 5,588.4 | 10,451.9 | 10,583.6 | 6,562.1 | 7,665.8 | 9,130.3 | 10,248.4 | 11,503.3 | 12,911.9 | 14,493.1 |
| Accounts Payable, % | 6.47 | 8.06 | 6.96 | 4.82 | 6.11 | 6.48 | 6.48 | 6.48 | 6.48 | 6.48 |
| Capital Expenditure | -8,172.5 | -6,007.1 | -2,955.3 | -4,934.7 | -4,435.7 | -6,532.1 | -7,332.0 | -8,229.8 | -9,237.6 | -10,368.8 |
| Capital Expenditure, % | -9.46 | -4.63 | -1.94 | -3.62 | -3.54 | -4.64 | -4.64 | -4.64 | -4.64 | -4.64 |
| Tax Rate, % | -692.96 | -692.96 | -692.96 | -692.96 | -692.96 | -692.96 | -692.96 | -692.96 | -692.96 | -692.96 |
| EBITAT | 2,960.6 | 3,981.6 | 1,149.6 | 2,991.8 | 19,698.3 | 3,428.2 | 3,848.0 | 4,319.2 | 4,848.1 | 5,441.8 |
| Depreciation | ||||||||||
| Changes in Account Receivables | ||||||||||
| Changes in Inventories | ||||||||||
| Changes in Accounts Payable | ||||||||||
| Capital Expenditure | ||||||||||
| UFCF | -12,048.4 | 624.7 | -86.6 | -768.2 | 20,227.3 | -924.3 | -1,241.7 | -1,393.7 | -1,564.4 | -1,755.9 |
| WACC, % | 4.6 | 5.05 | 5.78 | 5.89 | 5.89 | 5.44 | 5.44 | 5.44 | 5.44 | 5.44 |
| PV UFCF | ||||||||||
| SUM PV UFCF | -5,795.1 | |||||||||
| Long Term Growth Rate, % | 3.50 | |||||||||
| Free cash flow (T + 1) | -1,817 | |||||||||
| Terminal Value | -93,610 | |||||||||
| Present Terminal Value | -71,823 | |||||||||
| Enterprise Value | -77,618 | |||||||||
| Net Debt | 45,393 | |||||||||
| Equity Value | -123,011 | |||||||||
| Diluted Shares Outstanding, MM | 3,342 | |||||||||
| Equity Value Per Share | -36.81 |
Benefits You Will Enjoy
- Customizable Excel Template: An adaptable Excel-based DCF Calculator featuring pre-filled real financial data for Hengyi Petrochemical Co., Ltd. (000703SZ).
- Real-World Insights: Access to historical data and forward-looking projections (highlighted in the yellow cells).
- Adaptable Forecasting: Modify forecast parameters such as revenue growth, EBITDA %, and WACC.
- Instant Calculations: Quickly observe how your input adjustments affect Hengyi Petrochemical's valuation.
- Professional Quality Tool: Designed for investors, CFOs, consultants, and financial analysts.
- Intuitive Interface: Organized for simplicity and ease of use, complete with step-by-step guidance.
Key Features
- Real-Life Hengyi Data: Pre-filled with Hengyi Petrochemical’s historical financial performance and forward-looking forecasts.
- Fully Customizable Inputs: Modify revenue growth, profit margins, WACC, tax rates, and capital expenditures to suit your analysis.
- Dynamic Valuation Model: Real-time updates to Net Present Value (NPV) and intrinsic value based on your specified inputs.
- Scenario Testing: Develop various forecasting scenarios to evaluate different valuation results.
- User-Friendly Design: Intuitive and organized interface tailored for both experts and novices.
How It Works
- 1. Download the Template: Acquire and open the Excel file featuring Hengyi Petrochemical Co., Ltd.'s (000703SZ) preloaded data.
- 2. Adjust Inputs: Modify essential parameters such as growth rates, WACC, and capital expenditures.
- 3. Instant Results: The DCF model automatically computes intrinsic value and NPV in real time.
- 4. Explore Scenarios: Evaluate different forecasts to understand various valuation possibilities.
- 5. Present with Assurance: Deliver professional valuation insights to back your strategic decisions.
Why Choose This Calculator for Hengyi Petrochemical Co., Ltd. (000703SZ)?
- Accurate Data: Utilize real financial figures from Hengyi Petrochemical for dependable valuation outcomes.
- Customizable: Modify essential parameters such as growth rates, WACC, and tax rates to align with your forecasts.
- Time-Saving: Ready-to-use calculations help you avoid starting from the ground up.
- Professional-Grade Tool: Tailored for investors, analysts, and consultants in the petrochemical sector.
- User-Friendly: Easy-to-navigate design with step-by-step guidance ensures accessibility for all users.
Who Can Benefit from This Product?
- Investors: Evaluate Hengyi Petrochemical’s valuation before making stock transactions (000703SZ).
- CFOs and Financial Analysts: Enhance valuation workflows and assess financial forecasts.
- Startup Founders: Understand how large public companies like Hengyi Petrochemical are valued (000703SZ).
- Consultants: Provide detailed valuation reports for your clients based on Hengyi Petrochemical’s data.
- Students and Educators: Utilize real-time data for practicing and teaching valuation methodologies.
Contents of the Template
- Preloaded HENGYI Data: Historical and projected financial metrics, including revenue, EBIT, and capital expenditures.
- DCF and WACC Models: Advanced sheets for calculating intrinsic value and the Weighted Average Cost of Capital.
- Editable Inputs: Yellow-highlighted cells for modifying revenue growth, tax rates, and discount rates.
- Financial Statements: Detailed annual and quarterly financial statements for in-depth analysis.
- Key Ratios: Profitability, leverage, and efficiency ratios to assess performance.
- Dashboard and Charts: Visual representations of valuation results and underlying assumptions.
Disclaimer
All information, articles, and product details provided on this website are for general informational and educational purposes only. We do not claim any ownership over, nor do we intend to infringe upon, any trademarks, copyrights, logos, brand names, or other intellectual property mentioned or depicted on this site. Such intellectual property remains the property of its respective owners, and any references here are made solely for identification or informational purposes, without implying any affiliation, endorsement, or partnership.
We make no representations or warranties, express or implied, regarding the accuracy, completeness, or suitability of any content or products presented. Nothing on this website should be construed as legal, tax, investment, financial, medical, or other professional advice. In addition, no part of this site—including articles or product references—constitutes a solicitation, recommendation, endorsement, advertisement, or offer to buy or sell any securities, franchises, or other financial instruments, particularly in jurisdictions where such activity would be unlawful.
All content is of a general nature and may not address the specific circumstances of any individual or entity. It is not a substitute for professional advice or services. Any actions you take based on the information provided here are strictly at your own risk. You accept full responsibility for any decisions or outcomes arising from your use of this website and agree to release us from any liability in connection with your use of, or reliance upon, the content or products found herein.