
|
TPV Technology Co., Ltd. (000727.SZ) DCF Valuation |
Fully Editable: Tailor To Your Needs In Excel Or Sheets
Professional Design: Trusted, Industry-Standard Templates
Investor-Approved Valuation Models
MAC/PC Compatible, Fully Unlocked
No Expertise Is Needed; Easy To Follow
TPV Technology Co., Ltd. (000727.SZ) Bundle
Explore the financial future of TPV Technology Co., Ltd. (000727SZ) with our user-friendly DCF Calculator! Enter your assumptions regarding growth, margins, and costs to calculate the intrinsic value of TPV Technology Co., Ltd. (000727SZ) and refine your investment strategy.
What You Will Receive
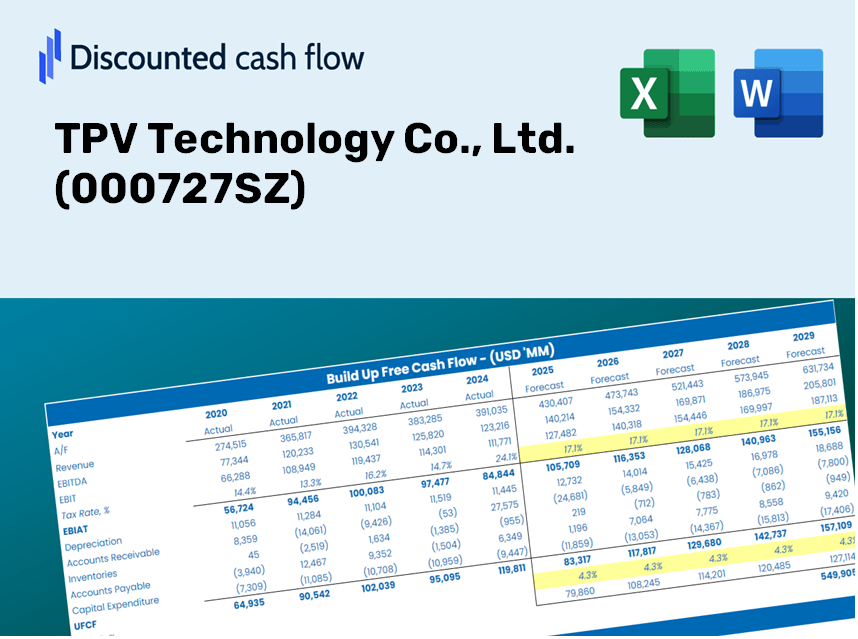
- Authentic TPV Data: Comprehensive financials – from revenue to EBIT – derived from actual and projected figures.
- Complete Customization: Modify all essential parameters (yellow cells) such as WACC, growth %, and tax rates.
- Real-Time Valuation Updates: Automatic recalculations for assessing the impact of changes on TPV’s fair value.
- Flexible Excel Template: Designed for quick modifications, scenario analysis, and in-depth projections.
- Efficient and Precise: Eliminate the need to build models from the ground up while ensuring accuracy and adaptability.
Key Features
- Comprehensive DCF Calculator: Features intricate unlevered and levered DCF valuation models tailored for TPV Technology Co., Ltd. (000727SZ).
- WACC Estimator: Comes with a pre-configured Weighted Average Cost of Capital sheet that allows for personalized input adjustments.
- Customizable Forecast Inputs: Easily adjust growth rates, capital expenditures, and discount rates to align with TPV Technology’s financial outlook.
- Integrated Financial Ratios: Evaluate profitability, leverage, and efficiency ratios specific to TPV Technology Co., Ltd. (000727SZ).
- Interactive Dashboard and Charts: Visual representations of key valuation metrics facilitate straightforward analysis and interpretation.
How It Works
- Step 1: Download the prebuilt Excel template featuring TPV Technology Co., Ltd.'s data.
- Step 2: Review the pre-filled sheets to familiarize yourself with the essential metrics.
- Step 3: Adjust forecasts and assumptions in the editable yellow cells (WACC, growth, margins).
- Step 4: Instantly see recalculated results, including TPV Technology Co., Ltd.'s intrinsic value.
- Step 5: Use the outputs to make informed investment decisions or create detailed reports.
Why Choose TPV Technology Co., Ltd. (000727SZ)?
- Save Time: Jump right in without the hassle of building a financial model – it’s ready for immediate use.
- Enhance Accuracy: Dependable financial metrics and formulas minimize valuation errors.
- Completely Customizable: Adapt the model to align with your unique assumptions and forecasts.
- User-Friendly: Intuitive charts and outputs facilitate straightforward analysis of results.
- Preferred by Professionals: Crafted for experts who seek both precision and ease of use.
Who Can Benefit from This Product?
- Investors: Evaluate TPV Technology Co., Ltd.’s (000727SZ) fair value to inform your investment strategy.
- CFOs: Utilize a high-quality DCF model for comprehensive financial analysis and reporting.
- Consultants: Easily tailor the template for client valuation reports focused on TPV Technology.
- Entrepreneurs: Discover financial modeling techniques employed by leading companies like TPV Technology.
- Educators: Implement it as a teaching resource to illustrate various valuation methods.
Contents of the Template
- Comprehensive DCF Model: Editable template featuring in-depth valuation calculations.
- Real-World Data: TPV Technology Co., Ltd. (000727SZ) historical and projected financials preloaded for analysis.
- Customizable Parameters: Modify WACC, growth rates, and tax assumptions to explore various scenarios.
- Financial Statements: Complete annual and quarterly breakdowns for enhanced insights.
- Key Ratios: Integrated analysis for profitability, efficiency, and leverage metrics.
- Dashboard with Visual Outputs: Graphs and tables for clear, actionable information.
Disclaimer
All information, articles, and product details provided on this website are for general informational and educational purposes only. We do not claim any ownership over, nor do we intend to infringe upon, any trademarks, copyrights, logos, brand names, or other intellectual property mentioned or depicted on this site. Such intellectual property remains the property of its respective owners, and any references here are made solely for identification or informational purposes, without implying any affiliation, endorsement, or partnership.
We make no representations or warranties, express or implied, regarding the accuracy, completeness, or suitability of any content or products presented. Nothing on this website should be construed as legal, tax, investment, financial, medical, or other professional advice. In addition, no part of this site—including articles or product references—constitutes a solicitation, recommendation, endorsement, advertisement, or offer to buy or sell any securities, franchises, or other financial instruments, particularly in jurisdictions where such activity would be unlawful.
All content is of a general nature and may not address the specific circumstances of any individual or entity. It is not a substitute for professional advice or services. Any actions you take based on the information provided here are strictly at your own risk. You accept full responsibility for any decisions or outcomes arising from your use of this website and agree to release us from any liability in connection with your use of, or reliance upon, the content or products found herein.