
|
China Nonferrous Metal Industry's Foreign Engineering and Construction Co.,Ltd. (000758.SZ) DCF Valuation |
Fully Editable: Tailor To Your Needs In Excel Or Sheets
Professional Design: Trusted, Industry-Standard Templates
Investor-Approved Valuation Models
MAC/PC Compatible, Fully Unlocked
No Expertise Is Needed; Easy To Follow
China Nonferrous Metal Industry's Foreign Engineering and Construction Co.,Ltd. (000758.SZ) Bundle
Optimize your time and improve precision with our (000758SZ) DCF Calculator! Utilizing real data from China Nonferrous Metal Industry's Foreign Engineering and Construction Co., Ltd., this tool allows you to forecast, analyze, and assess the value of the company just like a seasoned investor.
Discounted Cash Flow (DCF) - (USD MM)
| Year | AY1 2020 |
AY2 2021 |
AY3 2022 |
AY4 2023 |
AY5 2024 |
FY1 2025 |
FY2 2026 |
FY3 2027 |
FY4 2028 |
FY5 2029 |
|---|---|---|---|---|---|---|---|---|---|---|
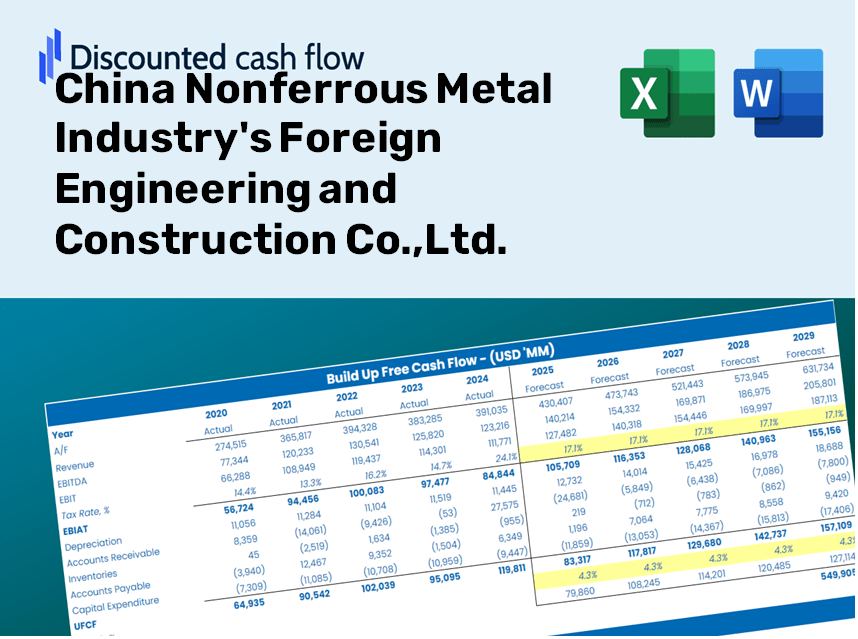
| Revenue | 6,785.8 | 6,532.6 | 7,372.4 | 9,361.4 | 8,917.9 | 9,617.2 | 10,371.3 | 11,184.6 | 12,061.6 | 13,007.4 |
| Revenue Growth, % | 0 | -3.73 | 12.86 | 26.98 | -4.74 | 7.84 | 7.84 | 7.84 | 7.84 | 7.84 |
| EBITDA | 789.9 | 481.7 | 754.0 | 935.2 | 618.6 | 888.0 | 957.7 | 1,032.7 | 1,113.7 | 1,201.1 |
| EBITDA, % | 11.64 | 7.37 | 10.23 | 9.99 | 6.94 | 9.23 | 9.23 | 9.23 | 9.23 | 9.23 |
| Depreciation | 355.1 | 284.1 | 242.5 | 227.0 | 241.1 | 346.2 | 373.4 | 402.7 | 434.2 | 468.3 |
| Depreciation, % | 5.23 | 4.35 | 3.29 | 2.43 | 2.7 | 3.6 | 3.6 | 3.6 | 3.6 | 3.6 |
| EBIT | 434.8 | 197.6 | 511.5 | 708.2 | 377.5 | 541.8 | 584.3 | 630.1 | 679.5 | 732.8 |
| EBIT, % | 6.41 | 3.03 | 6.94 | 7.56 | 4.23 | 5.63 | 5.63 | 5.63 | 5.63 | 5.63 |
| Total Cash | 3,360.6 | 3,599.7 | 3,184.9 | 3,891.3 | 3,615.8 | 4,422.8 | 4,769.6 | 5,143.6 | 5,546.9 | 5,981.8 |
| Total Cash, percent | .0 | .0 | .0 | .0 | .0 | .0 | .0 | .0 | .0 | .0 |
| Account Receivables | 6,041.6 | 3,136.1 | 4,776.3 | 2,918.8 | 2,521.4 | 5,025.5 | 5,419.6 | 5,844.6 | 6,302.9 | 6,797.1 |
| Account Receivables, % | 89.03 | 48.01 | 64.79 | 31.18 | 28.27 | 52.26 | 52.26 | 52.26 | 52.26 | 52.26 |
| Inventories | 1,551.9 | 1,742.0 | 1,877.7 | 1,860.0 | 2,564.5 | 2,377.9 | 2,564.4 | 2,765.5 | 2,982.3 | 3,216.2 |
| Inventories, % | 22.87 | 26.67 | 25.47 | 19.87 | 28.76 | 24.73 | 24.73 | 24.73 | 24.73 | 24.73 |
| Accounts Payable | 1,913.6 | 1,522.3 | 1,329.4 | 1,726.9 | 1,658.0 | 2,049.9 | 2,210.6 | 2,384.0 | 2,570.9 | 2,772.5 |
| Accounts Payable, % | 28.2 | 23.3 | 18.03 | 18.45 | 18.59 | 21.31 | 21.31 | 21.31 | 21.31 | 21.31 |
| Capital Expenditure | -203.8 | -136.7 | -200.0 | -612.0 | -537.9 | -392.0 | -422.7 | -455.8 | -491.6 | -530.1 |
| Capital Expenditure, % | -3 | -2.09 | -2.71 | -6.54 | -6.03 | -4.08 | -4.08 | -4.08 | -4.08 | -4.08 |
| Tax Rate, % | 40.21 | 40.21 | 40.21 | 40.21 | 40.21 | 40.21 | 40.21 | 40.21 | 40.21 | 40.21 |
| EBITAT | -33.0 | 21.4 | 139.4 | 392.3 | 225.7 | 166.1 | 179.1 | 193.1 | 208.3 | 224.6 |
| Depreciation | ||||||||||
| Changes in Account Receivables | ||||||||||
| Changes in Inventories | ||||||||||
| Changes in Accounts Payable | ||||||||||
| Capital Expenditure | ||||||||||
| UFCF | -5,561.5 | 2,492.8 | -1,786.9 | 2,280.0 | -447.2 | -1,805.3 | -290.0 | -312.8 | -337.3 | -363.7 |
| WACC, % | 5.48 | 5.56 | 5.69 | 5.91 | 5.95 | 5.72 | 5.72 | 5.72 | 5.72 | 5.72 |
| PV UFCF | ||||||||||
| SUM PV UFCF | -2,777.3 | |||||||||
| Long Term Growth Rate, % | 3.50 | |||||||||
| Free cash flow (T + 1) | -376 | |||||||||
| Terminal Value | -16,959 | |||||||||
| Present Terminal Value | -12,841 | |||||||||
| Enterprise Value | -15,618 | |||||||||
| Net Debt | -80 | |||||||||
| Equity Value | -15,538 | |||||||||
| Diluted Shares Outstanding, MM | 1,975 | |||||||||
| Equity Value Per Share | -7.87 |
Benefits You Will Receive
- Actual CNMC Financials: Access historical data and projections for precise valuation.
- Customizable Inputs: Adjust WACC, tax rates, revenue growth, and capital expenditures.
- Automatic Calculations: Intrinsic value and NPV are computed in real-time.
- Scenario Analysis: Explore various scenarios to assess CNMC’s future performance.
- User-Friendly Design: Designed for industry experts while remaining approachable for newcomers.
Key Features
- 🔍 Real-Life CNMC Financials: Pre-filled historical and projected data for China Nonferrous Metal Industry's Foreign Engineering and Construction Co., Ltd. (000758SZ).
- ✏️ Fully Customizable Inputs: Modify all essential parameters (yellow cells) such as WACC, growth %, and tax rates.
- 📊 Professional DCF Valuation: Integrated formulas assess the intrinsic value of CNMC using the Discounted Cash Flow method.
- ⚡ Instant Results: Immediately visualize CNMC’s valuation after adjustments are made.
- Scenario Analysis: Evaluate and compare diverse financial scenarios side-by-side.
How It Works
- Step 1: Download the prebuilt Excel template featuring data for China Nonferrous Metal Industry's Foreign Engineering and Construction Co., Ltd. (000758SZ).
- Step 2: Review the filled-out sheets to familiarize yourself with essential metrics.
- Step 3: Modify forecasts and assumptions in the editable yellow cells (WACC, growth, margins).
- Step 4: Instantly see the updated results, including the intrinsic value of China Nonferrous Metal Industry's Foreign Engineering and Construction Co., Ltd. (000758SZ).
- Step 5: Use the output data to make well-informed investment decisions or create detailed reports.
Why Choose This Calculator for China Nonferrous Metal Industry's Foreign Engineering and Construction Co., Ltd. (000758SZ)?
- Designed for Industry Experts: A sophisticated tool tailored for engineers, project managers, and financial analysts.
- Comprehensive Data: Historical and projected financials for China Nonferrous Metal Industry preloaded for precision.
- Flexible Scenario Analysis: Easily simulate various project forecasts and assumptions.
- Insightful Outputs: Automatically computes intrinsic value, NPV, and essential performance metrics.
- User-Friendly Interface: Step-by-step guidance simplifies your navigation through calculations.
Who Can Benefit from This Service?
- Investors: Assess the valuation of China Nonferrous Metal Industry's Foreign Engineering and Construction Co., Ltd. (000758SZ) before making investment decisions.
- CFOs and Financial Analysts: Optimize valuation processes and evaluate financial projections.
- Startup Founders: Understand how leading companies in the industry, like China Nonferrous (000758SZ), are valued.
- Consultants: Create comprehensive valuation reports for your clients.
- Students and Educators: Utilize real data to practice and teach valuation methodologies.
Overview of Template Features
- Preloaded CNMC Data: Historical and projected financial data, encompassing revenue, EBIT, and capital expenditures for China Nonferrous Metal Industry's Foreign Engineering and Construction Co., Ltd. (000758SZ).
- DCF and WACC Models: High-quality spreadsheets designed for calculating intrinsic value and Weighted Average Cost of Capital.
- Editable Inputs: Cells highlighted in yellow for easy adjustments to revenue growth, tax rates, and discount rates.
- Financial Statements: Detailed annual and quarterly financial data for thorough analysis.
- Key Ratios: Metrics for profitability, leverage, and efficiency to assess overall performance.
- Dashboard and Charts: Visual representations of valuation results and underlying assumptions.
Disclaimer
All information, articles, and product details provided on this website are for general informational and educational purposes only. We do not claim any ownership over, nor do we intend to infringe upon, any trademarks, copyrights, logos, brand names, or other intellectual property mentioned or depicted on this site. Such intellectual property remains the property of its respective owners, and any references here are made solely for identification or informational purposes, without implying any affiliation, endorsement, or partnership.
We make no representations or warranties, express or implied, regarding the accuracy, completeness, or suitability of any content or products presented. Nothing on this website should be construed as legal, tax, investment, financial, medical, or other professional advice. In addition, no part of this site—including articles or product references—constitutes a solicitation, recommendation, endorsement, advertisement, or offer to buy or sell any securities, franchises, or other financial instruments, particularly in jurisdictions where such activity would be unlawful.
All content is of a general nature and may not address the specific circumstances of any individual or entity. It is not a substitute for professional advice or services. Any actions you take based on the information provided here are strictly at your own risk. You accept full responsibility for any decisions or outcomes arising from your use of this website and agree to release us from any liability in connection with your use of, or reliance upon, the content or products found herein.