
|
SUFA Technology Industry Co., Ltd. CNNC (000777.SZ): Porter's 5 Forces Analysis |
Fully Editable: Tailor To Your Needs In Excel Or Sheets
Professional Design: Trusted, Industry-Standard Templates
Investor-Approved Valuation Models
MAC/PC Compatible, Fully Unlocked
No Expertise Is Needed; Easy To Follow
SUFA Technology Industry Co., Ltd. CNNC (000777.SZ) Bundle
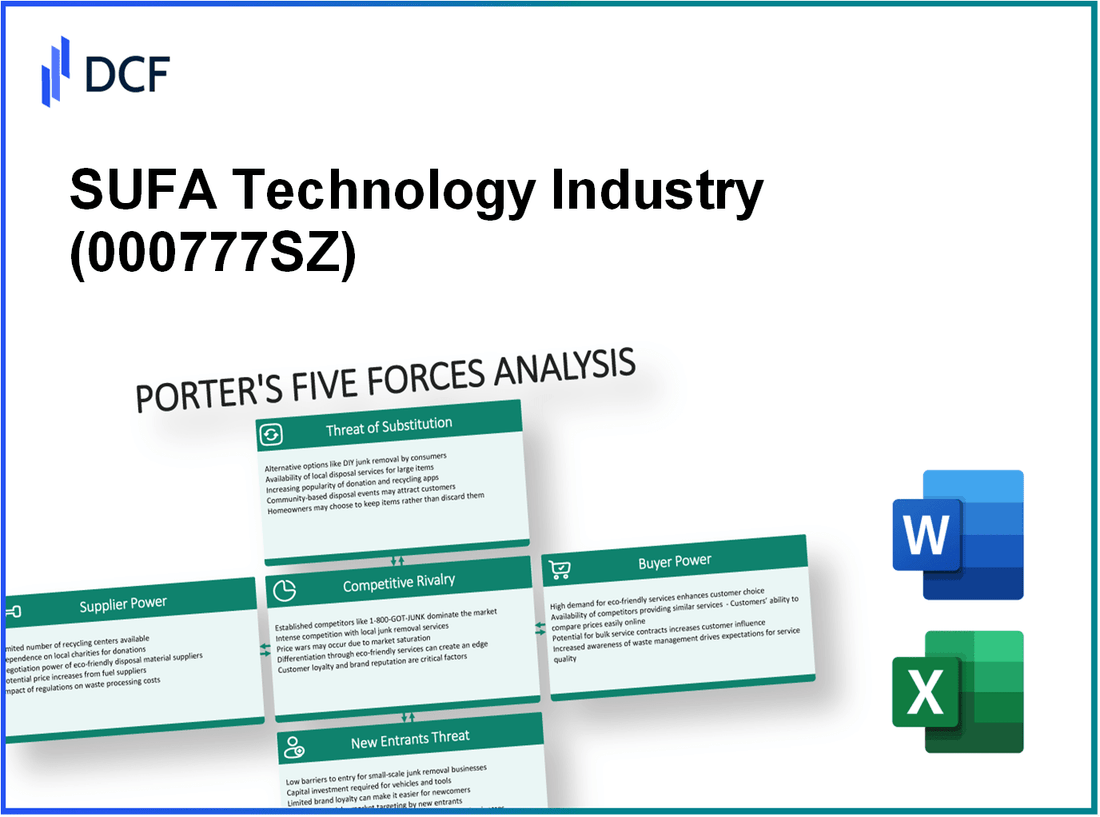
In the rapidly evolving landscape of the technology sector, understanding the dynamics of competitive forces is essential for any business. With insights drawn from Michael Porter's Five Forces Framework, we’ll delve into the intricate interplay of supplier and customer power, competitive rivalry, the looming threat of substitutes, and the barriers faced by new entrants in the case of SUFA Technology Industry Co., Ltd. (CNNC). This analysis unveils the strategic challenges and opportunities that define this industry, compelling you to navigate its complexities more effectively. Read on to discover how these forces shape the future of SUFA and its competitive positioning.
SUFA Technology Industry Co., Ltd. CNNC - Porter's Five Forces: Bargaining power of suppliers
The bargaining power of suppliers in the SUFA Technology Industry Co., Ltd. environment presents several key considerations based on the company's operational and market context.
Limited number of specialized suppliers
SUFA Technology relies on a limited number of specialized suppliers for its components, particularly in the manufacturing of equipment for the nuclear and energy sectors. In 2022, it was noted that there are approximately 20 key suppliers globally who provide essential materials and technology. This concentration heightens their bargaining power.
High switching costs for critical materials
Switching costs are significant in the industry. For instance, SUFA incurs costs related to retraining staff, reconfiguring processes, and testing new materials. Estimates suggest that switching from one key supplier could cost upwards of ¥10 million in direct and indirect expenses. This makes it less attractive for SUFA to switch suppliers, granting existing suppliers more leverage when negotiating contract terms.
Potential for forward integration by suppliers
Some suppliers possess the capacity to forward integrate into manufacturing. For example, companies supplying critical components may expand to offer completed systems directly. This potential reduces SUFA's negotiating power. In 2021, it was reported that certain suppliers were investing an average of 15% of their revenue back into advanced manufacturing capabilities, signaling an increased threat of forward integration.
Dependency on key technology inputs
SUFA’s dependency on specific technology inputs, such as proprietary software and specialized machinery, intensifies supplier power. This dependency is underscored by the fact that the company sources roughly 60% of its specialized technology from just five suppliers. The loss of any one supplier could disrupt operations significantly, giving those suppliers enhanced bargaining power.
Supplier concentration versus firm concentration
The supplier concentration ratio is notably high in the nuclear technology sector, with the top three suppliers holding 50% of the market share. In contrast, SUFA’s market position, while strong, only accounts for approximately 5% of the global nuclear component market. This disparity represents an imbalance in power, favoring the suppliers.
| Factor | Current Status | Impact on Bargaining Power |
|---|---|---|
| Number of Key Suppliers | 20 major suppliers | High |
| Switching Costs | ¥10 million | High |
| Potential Forward Integration | 15% investment in advanced capabilities | Medium |
| Dependency on Key Inputs | 60% from 5 suppliers | High |
| Supplier Market Share Concentration | 50% for top 3 suppliers | High |
| Firm Market Share | 5% of global market | Low |
Overall, the factors influencing supplier bargaining power indicate a challenging environment for SUFA Technology Industry Co., Ltd., where specialized suppliers exert substantial influence over pricing and contract negotiation terms.
SUFA Technology Industry Co., Ltd. CNNC - Porter's Five Forces: Bargaining power of customers
The bargaining power of customers in the SUFA Technology Industry Co., Ltd. context is influenced by several key factors.
High buyer knowledge due to industry transparency
In the technology industry, particularly for companies involved in nuclear power and manufacturing, transparency is high due to stringent regulatory requirements. Customers are well-informed about different technological options and industry standards. For instance, SUFA Technology's revenue for 2022 was approximately RMB 1.47 billion, reflecting their engagement with well-educated clients who can easily compare products and services offered by competitors.
Customer demand for customization and innovation
Customers increasingly demand tailored solutions, creating pressure on suppliers to innovate. In 2022, SUFA Technology reported that over 30% of their contracts involved customized solutions, indicating strong customer influence on product offerings. The industry trend shows an increasing emphasis on R&D, with approximately 10% of annual revenue reinvested in innovation, highlighting the customers' significant role in guiding these developments.
Availability of alternative suppliers
The presence of alternative suppliers enhances buyer power. In China, numerous companies compete in the nuclear technology sector, such as China National Nuclear Corporation (CNNC) and State Nuclear Power Technology Corporation (SNPTC). This competitive landscape leads to a potential shift in customer loyalty, especially since buyers often enjoy a 5% to 10% price difference when comparing suppliers. The table below illustrates the competitive landscape:
| Company | Yearly Revenue (RMB) | Market Share (%) |
|---|---|---|
| SUFA Technology | 1.47 billion | 15 |
| CNNC | 20 billion | 40 |
| SNPTC | 15 billion | 30 |
| Others | 7.5 billion | 15 |
Potential for backward integration by large buyers
Large customers in the energy sector, such as major utilities, possess the capability to integrate backward. This trend has been observed where companies like State Grid Corporation of China consider in-house production capabilities to reduce dependency on suppliers. The potential for backward integration raises concerns for firms like SUFA Technology regarding long-term contracts and pricing agreements.
Price sensitivity due to industry competitiveness
Price sensitivity is a determining factor in the bargaining power of customers. In the nuclear technology sector, operational costs are scrutinized closely. A survey conducted in 2023 indicated that 67% of customers would consider switching suppliers if price differences exceeded 3%. Additionally, SUFA Technology’s average contract price decreased by 8% in the last fiscal year, reflecting heightened competition and customer influences on pricing strategies.
SUFA Technology Industry Co., Ltd. CNNC - Porter's Five Forces: Competitive rivalry
High number of competitors in the market: The SUFA Technology industry is characterized by a significant number of players, including about 1,000 competitors in the broader nuclear technology sector. Key competitors include China National Nuclear Corporation (CNNC), Framatome, and General Electric. These companies possess substantial market shares, with CNNC holding approximately 20% of the domestic market in China.
Slow industry growth rate leading to fierce competition: The nuclear technology industry has seen a sluggish growth rate of about 2% CAGR over the last five years, primarily due to regulatory scrutiny and public concerns regarding safety. This stagnation has intensified competition among existing players as companies strive to capture market share, resulting in pricing wars and aggressive marketing strategies.
High fixed costs creating pressure for constant production: The capital-intensive nature of the nuclear sector requires high fixed costs, typically exceeding $1 billion for new plants. This drives companies like SUFA Technology to maximize production efficiency and maintain continuous operations to cover their costs. High fixed costs lead to lower margins during periods of reduced output, putting pressure on profitability.
Low product differentiation intensifying competition: Products offered in the nuclear technology market often lack significant differentiation. Most competing firms provide similar reactor components and services, making price a critical factor in purchasing decisions. This results in an average profit margin of around 8%, which compels companies to focus on cost leadership strategies to maintain competitive advantages.
Frequent technological advancements driving competition: The pace of technological development in the nuclear sector is rapid, with companies investing heavily in R&D. SUFA Technology has allocated approximately 15% of its annual revenue to R&D, amounting to around $75 million in 2022. In contrast, competitors like Westinghouse have invested over $100 million annually to develop advanced reactor designs, further escalating competitive pressures.
| Company | Market Share (%) | Annual R&D Investment (Million $) | Average Profit Margin (%) |
|---|---|---|---|
| SUFA Technology | 20 | 75 | 8 |
| China National Nuclear Corporation (CNNC) | 25 | 100 | 9 |
| Framatome | 15 | 90 | 7 |
| General Electric | 10 | 110 | 10 |
| Westinghouse | 20 | 100 | 8 |
SUFA Technology Industry Co., Ltd. CNNC - Porter's Five Forces: Threat of substitutes
The threat of substitutes in the technology and energy industry is notable for SUFA Technology Industry Co., Ltd. as rapid technological evolution continuously introduces alternatives that compete for market share.
Rapid technological evolution creating new alternatives
Emerging technologies such as renewable energy sources, including solar and wind, are evolving rapidly. According to the International Renewable Energy Agency (IRENA), global solar capacity reached 1,000 GW in 2021, with substantial growth expected, possibly surpassing 2,000 GWby 2025. This development presents a significant threat to traditional power generation technologies.
High customer tendency to explore emerging solutions
Customers in the energy sector are increasingly willing to explore alternatives. A 2022 survey by Deloitte indicated that 64% of consumers expressed a preference for renewable energy solutions over traditional sources. This trend is driven by a combination of environmental concerns and the increasing availability of cost-effective renewable solutions.
Substitutes offering cost advantages
Cost is a pivotal factor influencing consumer decisions regarding substitutes. The levelized cost of electricity (LCOE) for solar and wind energy has declined significantly, with solar LCOE dropping to approximately $50/MWh in 2021, compared to traditional coal at about $100/MWh. This price differential makes renewable alternatives more attractive to buyers, intensifying the threat to traditional energy providers.
Industry shifts due to environmental and regulatory changes
Regulatory policies favoring cleaner technologies impact the threat of substitutes. The European Union's Green Deal aims to cut greenhouse gas emissions by at least 55% by 2030, incentivizing the adoption of substitutes such as electric vehicles (EVs). The EV market is projected to grow, with analysts estimating that sales could reach 26 million units by 2030, up from 3 million in 2020, altering the competitive landscape significantly.
Increasing performance and efficiency of substitutes
The performance improvements of substitutes further exacerbate this threat. For instance, battery technology advancements have increased the energy density of lithium-ion batteries, with recent developments achieving densities over 250 Wh/kg. This advancement enhances the attractiveness of electric vehicles and energy storage solutions, allowing them to compete more effectively with traditional power sources.
| Type of Substitute | Current Price (USD/MWh) | Projected Growth (2025) | Efficiency (2021) |
|---|---|---|---|
| Coal | $100 | - | 34% |
| Natural Gas | $70 | - | 42% |
| Solar Energy | $50 | $1200 billion (investment by 2025) | 20% |
| Wind Energy | $40 | $900 billion (investment by 2025) | 35% |
| Electric Vehicles | Varies (Average Lifecycle Cost) | 26 million units sold by 2030 | - |
The evolving landscape presents a significant challenge for SUFA Technology Industry Co., Ltd., as the threat of substitutes introduces competitive pressures from various fronts, ultimately shaping strategic decisions within the organization.
SUFA Technology Industry Co., Ltd. CNNC - Porter's Five Forces: Threat of new entrants
The threat of new entrants into the SUFA Technology Industry, part of the China National Nuclear Corporation (CNNC), is influenced by several crucial factors that determine the overall market landscape.
High capital requirements for industry entry
Entering the SUFA Technology Industry necessitates significant capital investment, often exceeding ¥100 million for initial setup and equipment. The high capital requirement serves as a formidable barrier, deterring smaller firms from entering the market.
Stringent regulatory and licensing prerequisites
The industry is subject to rigorous regulatory standards, which include obtaining multiple licenses from governing bodies such as the National Nuclear Safety Administration (NNSA). Compliance costs can reach up to ¥10 million annually, creating another roadblock for prospective entrants.
Strong brand loyalty and customer relationships of existing firms
Established players like SUFA have cultivated strong brand loyalty, contributing to a market share of approximately 30%. This entrenched loyalty makes it difficult for new entrants to attract customers who are already engaged with existing brands.
Economies of scale achieved by established competitors
SUFA, along with its competitors, benefits from economies of scale, allowing them to lower average costs as production volumes increase. For instance, SUFA reported production cost savings of around 15% due to scale efficiencies in its latest financial report, further enhancing their competitive edge.
Technological expertise and patents protecting incumbents
Established companies in this sector possess extensive technological expertise and hold numerous patents. SUFA currently holds over 100 patents related to their product lines, securing their market position and making it difficult for new entrants to replicate their offerings without incurring substantial R&D costs.
| Factor | Details |
|---|---|
| Capital Investment Requirement | ¥100 million minimum |
| Annual Compliance Costs | ¥10 million |
| Market Share of Established Firms | 30% |
| Production Cost Savings from Economies of Scale | 15% |
| Number of Patents Held by SUFA | 100+ |
As illustrated, the combination of high capital investment, rigorous regulatory hurdles, established loyalty, economies of scale, and technological barriers significantly diminishes the threat posed by new entrants in the SUFA Technology Industry. These factors collectively fortify the market position of SUFA, ensuring sustained profitability in a competitive landscape.
The dynamics within the SUFA Technology Industry Co., Ltd. reveal a complex interplay of forces that shape its market landscape. With the bargaining power of suppliers and customers influencing pricing and innovation, competitive rivalry intensifying due to low differentiation, and an ever-present threat from substitutes and new entrants, the company must navigate these challenges strategically to sustain its growth and market position.
[right_small]Disclaimer
All information, articles, and product details provided on this website are for general informational and educational purposes only. We do not claim any ownership over, nor do we intend to infringe upon, any trademarks, copyrights, logos, brand names, or other intellectual property mentioned or depicted on this site. Such intellectual property remains the property of its respective owners, and any references here are made solely for identification or informational purposes, without implying any affiliation, endorsement, or partnership.
We make no representations or warranties, express or implied, regarding the accuracy, completeness, or suitability of any content or products presented. Nothing on this website should be construed as legal, tax, investment, financial, medical, or other professional advice. In addition, no part of this site—including articles or product references—constitutes a solicitation, recommendation, endorsement, advertisement, or offer to buy or sell any securities, franchises, or other financial instruments, particularly in jurisdictions where such activity would be unlawful.
All content is of a general nature and may not address the specific circumstances of any individual or entity. It is not a substitute for professional advice or services. Any actions you take based on the information provided here are strictly at your own risk. You accept full responsibility for any decisions or outcomes arising from your use of this website and agree to release us from any liability in connection with your use of, or reliance upon, the content or products found herein.