
|
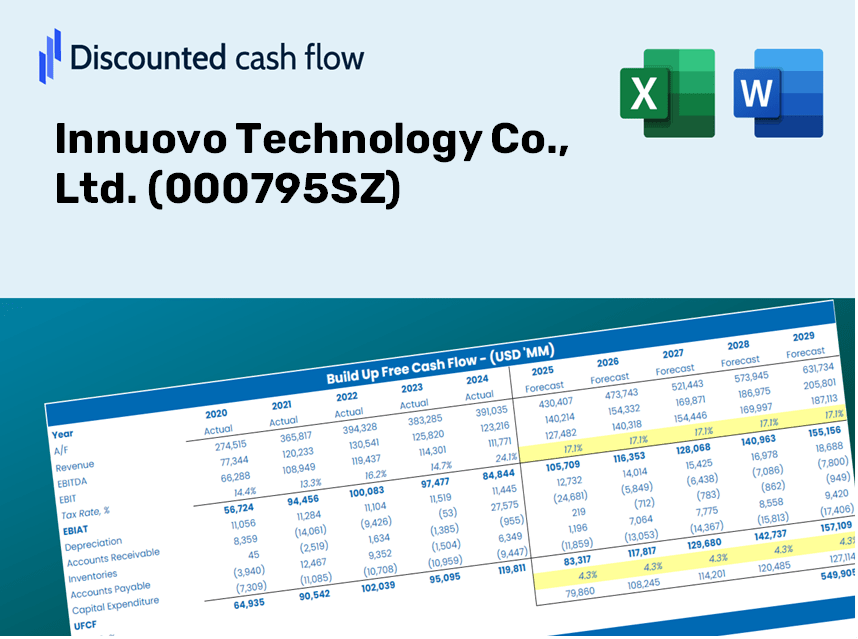
Innuovo Technology Co., Ltd. (000795.SZ) DCF Valuation |
Fully Editable: Tailor To Your Needs In Excel Or Sheets
Professional Design: Trusted, Industry-Standard Templates
Investor-Approved Valuation Models
MAC/PC Compatible, Fully Unlocked
No Expertise Is Needed; Easy To Follow
Innuovo Technology Co., Ltd. (000795.SZ) Bundle
Evaluate Innuovo Technology Co., Ltd.'s financial prospects with expertise! This (000795SZ) DCF Calculator provides you with pre-filled financial data and full flexibility to modify revenue growth, WACC, margins, and other essential assumptions to align with your forecasts.
Discounted Cash Flow (DCF) - (USD MM)
| Year | AY1 2020 |
AY2 2021 |
AY3 2022 |
AY4 2023 |
AY5 2024 |
FY1 2025 |
FY2 2026 |
FY3 2027 |
FY4 2028 |
FY5 2029 |
|---|---|---|---|---|---|---|---|---|---|---|
| Revenue | 2,601.2 | 3,760.1 | 4,732.2 | 4,035.7 | 4,008.8 | 4,560.2 | 5,187.4 | 5,900.9 | 6,712.6 | 7,635.9 |
| Revenue Growth, % | 0 | 44.55 | 25.85 | -14.72 | -0.66638 | 13.75 | 13.75 | 13.75 | 13.75 | 13.75 |
| EBITDA | 137.4 | 204.4 | 334.0 | 243.6 | 311.1 | 288.0 | 327.6 | 372.6 | 423.9 | 482.2 |
| EBITDA, % | 5.28 | 5.44 | 7.06 | 6.04 | 7.76 | 6.32 | 6.32 | 6.32 | 6.32 | 6.32 |
| Depreciation | 88.7 | 108.5 | 100.9 | 120.5 | 115.2 | 130.3 | 148.2 | 168.6 | 191.8 | 218.2 |
| Depreciation, % | 3.41 | 2.88 | 2.13 | 2.99 | 2.87 | 2.86 | 2.86 | 2.86 | 2.86 | 2.86 |
| EBIT | 48.8 | 96.0 | 233.1 | 123.1 | 195.9 | 157.7 | 179.4 | 204.1 | 232.1 | 264.1 |
| EBIT, % | 1.87 | 2.55 | 4.93 | 3.05 | 4.89 | 3.46 | 3.46 | 3.46 | 3.46 | 3.46 |
| Total Cash | 910.4 | 480.8 | 948.7 | 1,222.1 | 1,029.8 | 1,129.2 | 1,284.5 | 1,461.2 | 1,662.1 | 1,890.8 |
| Total Cash, percent | .0 | .0 | .0 | .0 | .0 | .0 | .0 | .0 | .0 | .0 |
| Account Receivables | 936.5 | 1,086.4 | 1,302.4 | 1,089.9 | 1,103.2 | 1,340.2 | 1,524.5 | 1,734.2 | 1,972.7 | 2,244.1 |
| Account Receivables, % | 36 | 28.89 | 27.52 | 27.01 | 27.52 | 29.39 | 29.39 | 29.39 | 29.39 | 29.39 |
| Inventories | 724.7 | 1,171.2 | 943.4 | 763.0 | 736.0 | 1,059.9 | 1,205.7 | 1,371.5 | 1,560.2 | 1,774.7 |
| Inventories, % | 27.86 | 31.15 | 19.94 | 18.91 | 18.36 | 23.24 | 23.24 | 23.24 | 23.24 | 23.24 |
| Accounts Payable | 690.3 | 1,192.8 | 631.0 | 560.3 | 705.8 | 940.2 | 1,069.5 | 1,216.6 | 1,383.9 | 1,574.3 |
| Accounts Payable, % | 26.54 | 31.72 | 13.33 | 13.88 | 17.61 | 20.62 | 20.62 | 20.62 | 20.62 | 20.62 |
| Capital Expenditure | -121.0 | -146.5 | -137.8 | -89.4 | -194.7 | -169.0 | -192.3 | -218.7 | -248.8 | -283.0 |
| Capital Expenditure, % | -4.65 | -3.9 | -2.91 | -2.22 | -4.86 | -3.71 | -3.71 | -3.71 | -3.71 | -3.71 |
| Tax Rate, % | 8.41 | 8.41 | 8.41 | 8.41 | 8.41 | 8.41 | 8.41 | 8.41 | 8.41 | 8.41 |
| EBITAT | 66.6 | 100.0 | 224.7 | 99.0 | 179.5 | 147.7 | 168.0 | 191.2 | 217.5 | 247.4 |
| Depreciation | ||||||||||
| Changes in Account Receivables | ||||||||||
| Changes in Inventories | ||||||||||
| Changes in Accounts Payable | ||||||||||
| Capital Expenditure | ||||||||||
| UFCF | -936.7 | -31.9 | -362.1 | 452.2 | 259.2 | -217.5 | -76.8 | -87.4 | -99.4 | -113.1 |
| WACC, % | 4.57 | 4.57 | 4.56 | 4.54 | 4.55 | 4.56 | 4.56 | 4.56 | 4.56 | 4.56 |
| PV UFCF | ||||||||||
| SUM PV UFCF | -528.4 | |||||||||
| Long Term Growth Rate, % | 3.00 | |||||||||
| Free cash flow (T + 1) | -116 | |||||||||
| Terminal Value | -7,479 | |||||||||
| Present Terminal Value | -5,985 | |||||||||
| Enterprise Value | -6,513 | |||||||||
| Net Debt | -465 | |||||||||
| Equity Value | -6,049 | |||||||||
| Diluted Shares Outstanding, MM | 1,107 | |||||||||
| Equity Value Per Share | -5.47 |
What You Will Receive
- Customizable Excel Template: A fully editable DCF Calculator in Excel format, featuring real financial data for Innuovo Technology Co., Ltd. (000795SZ).
- Authentic Data: Access to historical performance data and future projections (highlighted in the yellow cells).
- Flexible Forecasting: Adjust key assumptions such as revenue growth, EBITDA %, and WACC at your discretion.
- Instant Calculations: Quickly visualize how your assumptions affect the valuation of Innuovo Technology Co., Ltd. (000795SZ).
- Professional Resource: Designed for use by investors, CFOs, consultants, and financial analysts.
- User-Centric Layout: Organized for simplicity and efficiency, complete with detailed step-by-step guidance.
Key Features
- Pre-Populated Data: Historical financial statements and pre-filled forecasts for Innuovo Technology Co., Ltd. (000795SZ).
- Customizable Inputs: Modify WACC, tax rates, revenue growth, and EBITDA margins as needed.
- Real-Time Results: Observe the recalculation of Innuovo's intrinsic value instantly.
- Comprehensive Visualizations: Dashboard charts offer clear displays of valuation results and essential metrics.
- Engineered for Precision: A professional-grade tool designed for analysts, investors, and finance professionals.
How It Functions
- Download: Obtain the pre-configured Excel file containing Innuovo Technology Co., Ltd.'s (000795SZ) financial data.
- Customize: Modify forecasts such as revenue growth, EBITDA %, and WACC to suit your analysis.
- Update Automatically: The intrinsic value and NPV calculations refresh in real-time as you make changes.
- Test Scenarios: Generate various projections and instantly compare the results.
- Make Decisions: Utilize the valuation outcomes to inform and direct your investment strategy.
Why Choose the Innuovo Technology Co., Ltd. Calculator?
- Precision: Utilizes authentic Innuovo financials for reliable data.
- Customization: Tailored for users to easily adjust and test inputs.
- Efficiency: Avoid the complexities of creating a DCF model from the ground up.
- Expert-Level: Crafted with the accuracy and usability expected at the CFO level.
- Intuitive: User-friendly design suitable for those without extensive financial modeling skills.
Who Can Benefit from Innuovo Technology Co., Ltd. (000795SZ)?
- Institutional Investors: Develop comprehensive and trust-worthy valuation models for effective portfolio management.
- Corporate Finance Professionals: Examine valuation scenarios to inform and shape corporate strategies.
- Consultants and Financial Advisors: Offer clients precise valuation insights related to Innuovo Technology Co., Ltd. (000795SZ).
- Academics and Students: Utilize real-life data to enhance learning and practice in financial modeling.
- Technology Aficionados: Gain insights into how tech companies like Innuovo Technology Co., Ltd. (000795SZ) are appraised in the market.
Contents of the Template
- Operating and Balance Sheet Data: Pre-filled historical data and forecasts for Innuovo Technology Co., Ltd. (000795SZ), including key figures such as revenue, EBITDA, EBIT, and capital expenditures.
- WACC Calculation: A specialized sheet for calculating the Weighted Average Cost of Capital (WACC), featuring essential parameters like Beta, risk-free rate, and share price.
- DCF Valuation (Unlevered and Levered): Customizable Discounted Cash Flow models that present intrinsic value alongside comprehensive calculations.
- Financial Statements: Pre-loaded annual and quarterly financial statements to assist in thorough analysis.
- Key Ratios: A collection of profitability, leverage, and efficiency ratios specific to Innuovo Technology Co., Ltd. (000795SZ).
- Dashboard and Charts: A visual overview of valuation outputs and assumptions for simplified analysis of results.
Disclaimer
All information, articles, and product details provided on this website are for general informational and educational purposes only. We do not claim any ownership over, nor do we intend to infringe upon, any trademarks, copyrights, logos, brand names, or other intellectual property mentioned or depicted on this site. Such intellectual property remains the property of its respective owners, and any references here are made solely for identification or informational purposes, without implying any affiliation, endorsement, or partnership.
We make no representations or warranties, express or implied, regarding the accuracy, completeness, or suitability of any content or products presented. Nothing on this website should be construed as legal, tax, investment, financial, medical, or other professional advice. In addition, no part of this site—including articles or product references—constitutes a solicitation, recommendation, endorsement, advertisement, or offer to buy or sell any securities, franchises, or other financial instruments, particularly in jurisdictions where such activity would be unlawful.
All content is of a general nature and may not address the specific circumstances of any individual or entity. It is not a substitute for professional advice or services. Any actions you take based on the information provided here are strictly at your own risk. You accept full responsibility for any decisions or outcomes arising from your use of this website and agree to release us from any liability in connection with your use of, or reliance upon, the content or products found herein.