
|
Yunnan Copper Co., Ltd. (000878.SZ) DCF Valuation |
Fully Editable: Tailor To Your Needs In Excel Or Sheets
Professional Design: Trusted, Industry-Standard Templates
Investor-Approved Valuation Models
MAC/PC Compatible, Fully Unlocked
No Expertise Is Needed; Easy To Follow
Yunnan Copper Co., Ltd. (000878.SZ) Bundle
Explore the financial outlook of Yunnan Copper Co., Ltd. (000878SZ) with our user-friendly DCF Calculator! Enter your assumptions regarding growth, margins, and expenses to determine the intrinsic value of Yunnan Copper Co., Ltd. (000878SZ) and enhance your investment approach.
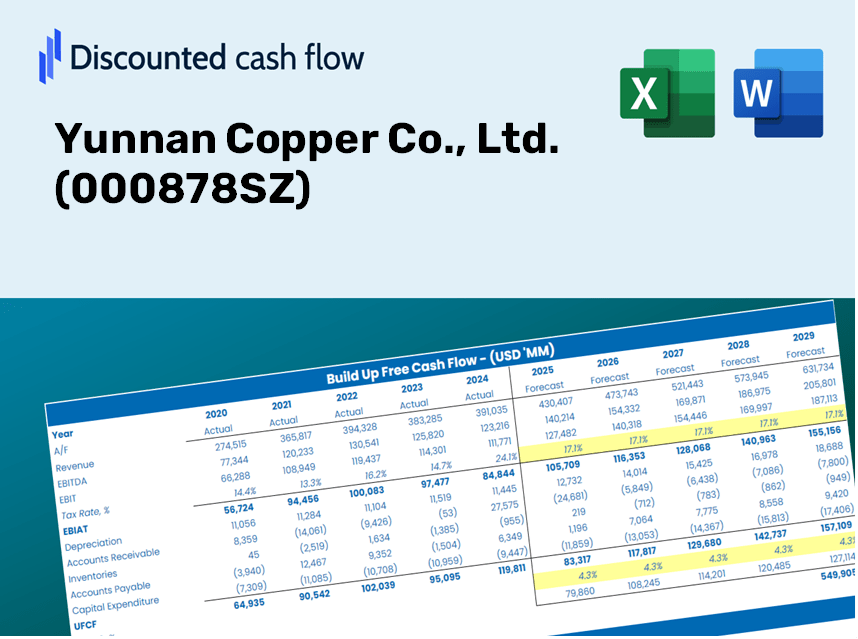
Discounted Cash Flow (DCF) - (USD MM)
| Year | AY1 2020 |
AY2 2021 |
AY3 2022 |
AY4 2023 |
AY5 2024 |
FY1 2025 |
FY2 2026 |
FY3 2027 |
FY4 2028 |
FY5 2029 |
|---|---|---|---|---|---|---|---|---|---|---|
| Revenue | 88,238.5 | 127,057.8 | 134,915.3 | 146,984.6 | 178,012.3 | 181,423.2 | 184,899.5 | 188,442.5 | 192,053.3 | 195,733.3 |
| Revenue Growth, % | 0 | 43.99 | 6.18 | 8.95 | 21.11 | 1.92 | 1.92 | 1.92 | 1.92 | 1.92 |
| EBITDA | 4,216.9 | 3,943.3 | 5,282.9 | 5,074.1 | 4,009.0 | 6,350.7 | 6,472.4 | 6,596.4 | 6,722.8 | 6,851.6 |
| EBITDA, % | 4.78 | 3.1 | 3.92 | 3.45 | 2.25 | 3.5 | 3.5 | 3.5 | 3.5 | 3.5 |
| Depreciation | 1,427.7 | 1,458.7 | 1,345.9 | 1,312.6 | 1,373.2 | 1,969.6 | 2,007.3 | 2,045.8 | 2,085.0 | 2,124.9 |
| Depreciation, % | 1.62 | 1.15 | 0.9976 | 0.893 | 0.77141 | 1.09 | 1.09 | 1.09 | 1.09 | 1.09 |
| EBIT | 2,789.2 | 2,484.6 | 3,937.0 | 3,761.6 | 2,635.8 | 4,381.2 | 4,465.1 | 4,550.7 | 4,637.9 | 4,726.7 |
| EBIT, % | 3.16 | 1.96 | 2.92 | 2.56 | 1.48 | 2.41 | 2.41 | 2.41 | 2.41 | 2.41 |
| Total Cash | 2,249.3 | 4,244.2 | 5,390.4 | 7,241.1 | 1,950.9 | 5,771.9 | 5,882.5 | 5,995.2 | 6,110.1 | 6,227.1 |
| Total Cash, percent | .0 | .0 | .0 | .0 | .0 | .0 | .0 | .0 | .0 | .0 |
| Account Receivables | 421.8 | 447.1 | 943.8 | .0 | 816.8 | 721.5 | 735.3 | 749.4 | 763.8 | 778.4 |
| Account Receivables, % | 0.47803 | 0.35192 | 0.69956 | 0 | 0.45887 | 0.39768 | 0.39768 | 0.39768 | 0.39768 | 0.39768 |
| Inventories | 11,990.2 | 10,848.1 | 10,325.7 | 10,790.1 | 12,649.6 | 16,047.5 | 16,355.0 | 16,668.4 | 16,987.8 | 17,313.3 |
| Inventories, % | 13.59 | 8.54 | 7.65 | 7.34 | 7.11 | 8.85 | 8.85 | 8.85 | 8.85 | 8.85 |
| Accounts Payable | 3,401.6 | 3,292.5 | 5,514.9 | 5,147.6 | 6,162.4 | 6,349.1 | 6,470.7 | 6,594.7 | 6,721.1 | 6,849.9 |
| Accounts Payable, % | 3.85 | 2.59 | 4.09 | 3.5 | 3.46 | 3.5 | 3.5 | 3.5 | 3.5 | 3.5 |
| Capital Expenditure | -998.2 | -565.7 | -1,030.2 | -1,663.9 | -3,602.9 | -1,994.2 | -2,032.4 | -2,071.4 | -2,111.1 | -2,151.5 |
| Capital Expenditure, % | -1.13 | -0.4452 | -0.76362 | -1.13 | -2.02 | -1.1 | -1.1 | -1.1 | -1.1 | -1.1 |
| Tax Rate, % | 45.39 | 45.39 | 45.39 | 45.39 | 45.39 | 45.39 | 45.39 | 45.39 | 45.39 | 45.39 |
| EBITAT | 988.0 | 974.6 | 2,194.3 | 2,149.8 | 1,439.3 | 2,121.7 | 2,162.4 | 2,203.8 | 2,246.0 | 2,289.1 |
| Depreciation | ||||||||||
| Changes in Account Receivables | ||||||||||
| Changes in Inventories | ||||||||||
| Changes in Accounts Payable | ||||||||||
| Capital Expenditure | ||||||||||
| UFCF | -7,592.9 | 2,875.3 | 4,758.1 | 1,910.6 | -2,451.9 | -1,018.9 | 1,937.6 | 1,974.7 | 2,012.5 | 2,051.1 |
| WACC, % | 6.31 | 6.37 | 6.6 | 6.62 | 6.59 | 6.5 | 6.5 | 6.5 | 6.5 | 6.5 |
| PV UFCF | ||||||||||
| SUM PV UFCF | 5,448.1 | |||||||||
| Long Term Growth Rate, % | 3.00 | |||||||||
| Free cash flow (T + 1) | 2,113 | |||||||||
| Terminal Value | 60,391 | |||||||||
| Present Terminal Value | 44,082 | |||||||||
| Enterprise Value | 49,530 | |||||||||
| Net Debt | 11,950 | |||||||||
| Equity Value | 37,580 | |||||||||
| Diluted Shares Outstanding, MM | 2,004 | |||||||||
| Equity Value Per Share | 18.76 |
What You Will Receive
- Adjustable Forecast Inputs: Effortlessly modify key assumptions (growth %, profit margins, WACC) for comprehensive scenario analysis.
- Industry-Specific Data: Yunnan Copper’s financial metrics pre-loaded to enhance your evaluation process.
- Automated DCF Calculations: The template computes Net Present Value (NPV) and intrinsic value automatically for you.
- Customizable and Professional Design: A refined Excel model tailored to fit your valuation requirements.
- Designed for Analysts and Investors: Perfect for assessing projections, confirming strategies, and optimizing your workflow.
Key Features
- Customizable Forecast Inputs: Adjust essential variables such as revenue growth, EBITDA percentage, and capital expenditures.
- Instant DCF Valuation: Quickly computes intrinsic value, NPV, and other key outputs.
- High-Precision Accuracy: Leverages Yunnan Copper’s real financial data for authentic valuation results.
- Simplified Scenario Analysis: Effortlessly test various assumptions and analyze outcomes side by side.
- Efficiency Booster: Streamlines the valuation process, eliminating the need for intricate model development from the ground up.
How It Functions
- 1. Access the Template: Download and open the Excel file containing Yunnan Copper Co., Ltd.'s (000878SZ) preloaded data.
- 2. Modify Assumptions: Adjust essential inputs such as growth rates, WACC, and capital expenditures.
- 3. View Results in Real-Time: The DCF model automatically computes the intrinsic value and NPV.
- 4. Evaluate Scenarios: Compare various forecasts to explore different valuation results.
- 5. Utilize with Assurance: Present professional valuation insights to bolster your decision-making.
Why Opt for Yunnan Copper Co., Ltd. (000878SZ) Calculator?
- Time-Efficient: Skip the hassle of building a DCF model from the ground up – it’s ready for immediate use.
- Enhanced Precision: Dependable financial metrics and formulas minimize valuation errors.
- Completely Adjustable: Customize the model to align with your specific assumptions and forecasts.
- Easy to Understand: Intuitive charts and outputs facilitate straightforward analysis of results.
- Endorsed by Professionals: Crafted for experts who prioritize accuracy and functionality.
Who Can Benefit from This Product?
- Finance Students: Master valuation techniques by applying them to real-world data.
- Academics: Integrate industry-standard models into your teaching or research projects.
- Investors: Validate your investment hypotheses and evaluate valuation results for Yunnan Copper Co., Ltd. (000878SZ).
- Analysts: Enhance your efficiency with a pre-designed, customizable DCF model.
- Small Business Owners: Understand the analytical methods used for assessing large public companies like Yunnan Copper Co., Ltd. (000878SZ).
Contents of the Template
- Pre-Filled Data: Features historical financial figures and forecasts for Yunnan Copper Co., Ltd. (000878SZ).
- Discounted Cash Flow Model: An editable DCF valuation model that performs automatic calculations.
- Weighted Average Cost of Capital (WACC): A specialized sheet for calculating WACC using customizable inputs.
- Key Financial Ratios: Evaluate Yunnan Copper’s profitability, efficiency, and financial leverage.
- Customizable Inputs: Easily modify revenue growth, margins, and tax rates to suit your analysis.
- Clear Dashboard: Visualize key valuation results through comprehensive charts and tables.
Disclaimer
All information, articles, and product details provided on this website are for general informational and educational purposes only. We do not claim any ownership over, nor do we intend to infringe upon, any trademarks, copyrights, logos, brand names, or other intellectual property mentioned or depicted on this site. Such intellectual property remains the property of its respective owners, and any references here are made solely for identification or informational purposes, without implying any affiliation, endorsement, or partnership.
We make no representations or warranties, express or implied, regarding the accuracy, completeness, or suitability of any content or products presented. Nothing on this website should be construed as legal, tax, investment, financial, medical, or other professional advice. In addition, no part of this site—including articles or product references—constitutes a solicitation, recommendation, endorsement, advertisement, or offer to buy or sell any securities, franchises, or other financial instruments, particularly in jurisdictions where such activity would be unlawful.
All content is of a general nature and may not address the specific circumstances of any individual or entity. It is not a substitute for professional advice or services. Any actions you take based on the information provided here are strictly at your own risk. You accept full responsibility for any decisions or outcomes arising from your use of this website and agree to release us from any liability in connection with your use of, or reliance upon, the content or products found herein.