
|
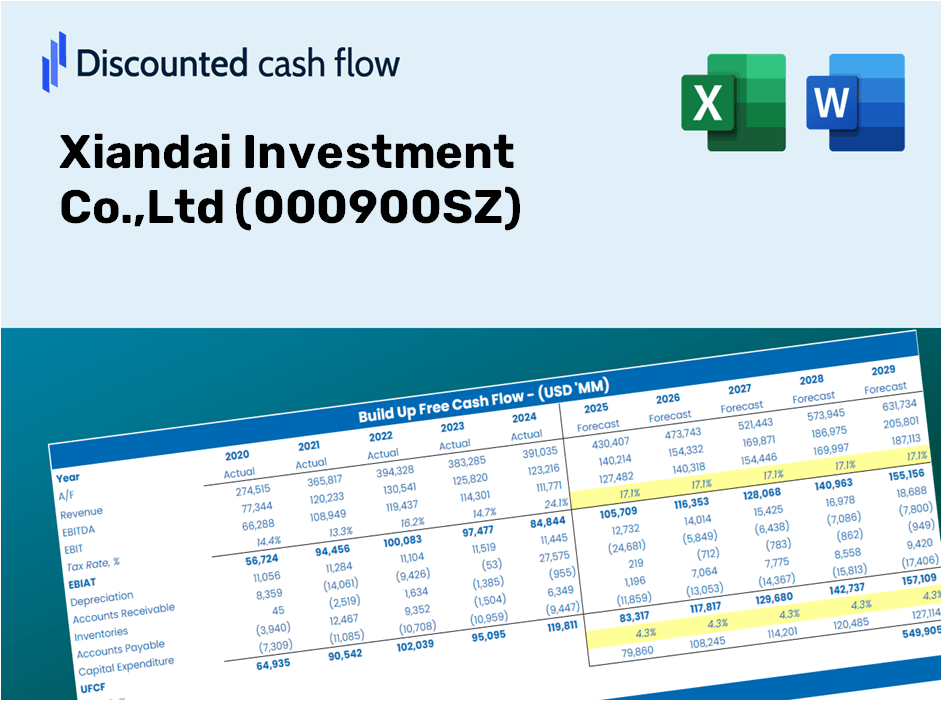
Xiandai Investment Co.,Ltd (000900.SZ) DCF Valuation |
Fully Editable: Tailor To Your Needs In Excel Or Sheets
Professional Design: Trusted, Industry-Standard Templates
Investor-Approved Valuation Models
MAC/PC Compatible, Fully Unlocked
No Expertise Is Needed; Easy To Follow
Xiandai Investment Co.,Ltd (000900.SZ) Bundle
Gain mastery over your Xiandai Investment Co.,Ltd (000900SZ) valuation analysis using our sophisticated DCF Calculator! Pre-filled with accurate (000900SZ) data, this Excel template enables you to adjust forecasts and assumptions for precisely calculating the intrinsic value of Xiandai Investment Co.,Ltd.
Discounted Cash Flow (DCF) - (USD MM)
| Year | AY1 2020 |
AY2 2021 |
AY3 2022 |
AY4 2023 |
AY5 2024 |
FY1 2025 |
FY2 2026 |
FY3 2027 |
FY4 2028 |
FY5 2029 |
|---|---|---|---|---|---|---|---|---|---|---|
| Revenue | 14,309.2 | 16,098.9 | 16,373.8 | 8,466.6 | 8,195.3 | 7,431.4 | 6,738.8 | 6,110.7 | 5,541.2 | 5,024.7 |
| Revenue Growth, % | 0 | 12.51 | 1.71 | -48.29 | -3.2 | -9.32 | -9.32 | -9.32 | -9.32 | -9.32 |
| EBITDA | 2,356.4 | 2,347.1 | 2,721.9 | 2,935.3 | 2,645.6 | 1,703.6 | 1,544.8 | 1,400.8 | 1,270.3 | 1,151.9 |
| EBITDA, % | 16.47 | 14.58 | 16.62 | 34.67 | 32.28 | 22.92 | 22.92 | 22.92 | 22.92 | 22.92 |
| Depreciation | 868.5 | 769.5 | 971.1 | 1,055.5 | 1,109.9 | 636.0 | 576.7 | 523.0 | 474.2 | 430.0 |
| Depreciation, % | 6.07 | 4.78 | 5.93 | 12.47 | 13.54 | 8.56 | 8.56 | 8.56 | 8.56 | 8.56 |
| EBIT | 1,487.9 | 1,577.6 | 1,750.7 | 1,879.8 | 1,535.6 | 1,067.6 | 968.1 | 877.9 | 796.0 | 721.9 |
| EBIT, % | 10.4 | 9.8 | 10.69 | 22.2 | 18.74 | 14.37 | 14.37 | 14.37 | 14.37 | 14.37 |
| Total Cash | 5,507.2 | 5,527.2 | 5,957.3 | 4,127.3 | 3,933.0 | 3,060.9 | 2,775.6 | 2,516.9 | 2,282.3 | 2,069.6 |
| Total Cash, percent | .0 | .0 | .0 | .0 | .0 | .0 | .0 | .0 | .0 | .0 |
| Account Receivables | 441.1 | 570.7 | 787.2 | 789.1 | 1,144.3 | 516.0 | 467.9 | 424.3 | 384.7 | 348.9 |
| Account Receivables, % | 3.08 | 3.54 | 4.81 | 9.32 | 13.96 | 6.94 | 6.94 | 6.94 | 6.94 | 6.94 |
| Inventories | 709.5 | 674.6 | 268.1 | 217.8 | 641.5 | 314.9 | 285.5 | 258.9 | 234.8 | 212.9 |
| Inventories, % | 4.96 | 4.19 | 1.64 | 2.57 | 7.83 | 4.24 | 4.24 | 4.24 | 4.24 | 4.24 |
| Accounts Payable | 727.8 | 966.6 | 560.6 | 422.2 | 692.4 | 415.4 | 376.7 | 341.6 | 309.8 | 280.9 |
| Accounts Payable, % | 5.09 | 6 | 3.42 | 4.99 | 8.45 | 5.59 | 5.59 | 5.59 | 5.59 | 5.59 |
| Capital Expenditure | -533.2 | -328.6 | -285.8 | -328.2 | -217.0 | -208.6 | -189.2 | -171.5 | -155.6 | -141.1 |
| Capital Expenditure, % | -3.73 | -2.04 | -1.75 | -3.88 | -2.65 | -2.81 | -2.81 | -2.81 | -2.81 | -2.81 |
| Tax Rate, % | 43.55 | 43.55 | 43.55 | 43.55 | 43.55 | 43.55 | 43.55 | 43.55 | 43.55 | 43.55 |
| EBITAT | 1,087.7 | 1,218.5 | 1,257.7 | 1,271.4 | 866.8 | 739.3 | 670.4 | 607.9 | 551.3 | 499.9 |
| Depreciation | ||||||||||
| Changes in Account Receivables | ||||||||||
| Changes in Inventories | ||||||||||
| Changes in Accounts Payable | ||||||||||
| Capital Expenditure | ||||||||||
| UFCF | 1,000.3 | 1,803.6 | 1,726.9 | 1,908.8 | 1,251.2 | 1,844.5 | 1,096.7 | 994.5 | 901.8 | 817.7 |
| WACC, % | 3.32 | 3.45 | 3.29 | 3.16 | 2.83 | 3.21 | 3.21 | 3.21 | 3.21 | 3.21 |
| PV UFCF | ||||||||||
| SUM PV UFCF | 5,214.4 | |||||||||
| Long Term Growth Rate, % | 1.00 | |||||||||
| Free cash flow (T + 1) | 826 | |||||||||
| Terminal Value | 37,397 | |||||||||
| Present Terminal Value | 31,934 | |||||||||
| Enterprise Value | 37,148 | |||||||||
| Net Debt | 21,071 | |||||||||
| Equity Value | 16,078 | |||||||||
| Diluted Shares Outstanding, MM | 1,518 | |||||||||
| Equity Value Per Share | 10.59 |
What You Will Receive
- Authentic (000900SZ) Financial Data: Pre-filled with Xiandai Investment Co., Ltd’s historical and projected data for accurate analysis.
- Completely Customizable Template: Easily adjust key inputs such as revenue growth, WACC, and EBITDA percentage.
- Instant Calculations: Watch the intrinsic value of Xiandai Investment Co., Ltd update in real-time as you make changes.
- Expert Valuation Tool: Tailored for investors, analysts, and consultants aiming for precise DCF outcomes.
- Intuitive Design: Clear layout and straightforward instructions suitable for users of all skill levels.
Key Features
- Customizable Investment Parameters: Adjust essential inputs such as revenue growth rates, EBITDA margins, and capital expenditures specific to Xiandai Investment Co., Ltd (000900SZ).
- Instant DCF Valuation: Automatically computes intrinsic value, NPV, and additional financial metrics with ease.
- High Precision Analytics: Leverages Xiandai's actual financial data to provide accurate valuation results.
- Effortless Scenario Analysis: Easily explore various assumptions and compare results side by side.
- Efficiency Booster: Streamline your workflow by eliminating the need to construct intricate valuation models from the ground up.
How It Functions
- Step 1: Download the prebuilt Excel template containing data for Xiandai Investment Co.,Ltd (000900SZ).
- Step 2: Review the filled sheets to gain insights into the essential metrics.
- Step 3: Modify forecasts and assumptions in the editable yellow cells (WACC, growth, margins).
- Step 4: Instantly see the recalculated outcomes, including the intrinsic value of Xiandai Investment Co.,Ltd (000900SZ).
- Step 5: Utilize the results to make well-informed investment decisions or create comprehensive reports.
Why Choose This Calculator for Xiandai Investment Co., Ltd (000900SZ)?
- User-Friendly Interface: Perfectly crafted for both novices and seasoned professionals.
- Customizable Inputs: Adjust parameters effortlessly to suit your analytical needs.
- Real-Time Valuations: Instantly observe changes in Xiandai’s valuation as you tweak the inputs.
- Pre-Configured Data: Comes with Xiandai’s current financial information for swift assessments.
- Relied Upon by Experts: Favored by investors and analysts for making strategic decisions.
Who Can Benefit from Xiandai Investment Co., Ltd (000900SZ)?
- Investors: Make informed choices with a top-tier valuation tool designed for precision.
- Financial Analysts: Enhance efficiency with a customizable DCF model at your fingertips.
- Consultants: Streamline your workflow by easily modifying the template for client presentations or reports.
- Finance Enthusiasts: Expand your knowledge of valuation methodologies through practical, real-world examples.
- Educators and Students: Utilize this resource as an effective teaching aid in finance-related academic programs.
What the Template Contains
- Historical Data: Features Xiandai Investment Co., Ltd.'s (000900SZ) previous financial performance and foundational forecasts.
- DCF and Levered DCF Models: Comprehensive templates for assessing the intrinsic value of Xiandai Investment Co., Ltd. (000900SZ).
- WACC Sheet: Ready-to-use calculations for the Weighted Average Cost of Capital specific to Xiandai Investment Co., Ltd. (000900SZ).
- Editable Inputs: Customize essential variables such as growth rates, EBITDA %, and CAPEX assumptions.
- Quarterly and Annual Statements: A thorough analysis of Xiandai Investment Co., Ltd.'s (000900SZ) financial statements.
- Interactive Dashboard: Dynamically visualize valuation outcomes and forecasts.
Disclaimer
All information, articles, and product details provided on this website are for general informational and educational purposes only. We do not claim any ownership over, nor do we intend to infringe upon, any trademarks, copyrights, logos, brand names, or other intellectual property mentioned or depicted on this site. Such intellectual property remains the property of its respective owners, and any references here are made solely for identification or informational purposes, without implying any affiliation, endorsement, or partnership.
We make no representations or warranties, express or implied, regarding the accuracy, completeness, or suitability of any content or products presented. Nothing on this website should be construed as legal, tax, investment, financial, medical, or other professional advice. In addition, no part of this site—including articles or product references—constitutes a solicitation, recommendation, endorsement, advertisement, or offer to buy or sell any securities, franchises, or other financial instruments, particularly in jurisdictions where such activity would be unlawful.
All content is of a general nature and may not address the specific circumstances of any individual or entity. It is not a substitute for professional advice or services. Any actions you take based on the information provided here are strictly at your own risk. You accept full responsibility for any decisions or outcomes arising from your use of this website and agree to release us from any liability in connection with your use of, or reliance upon, the content or products found herein.