
|
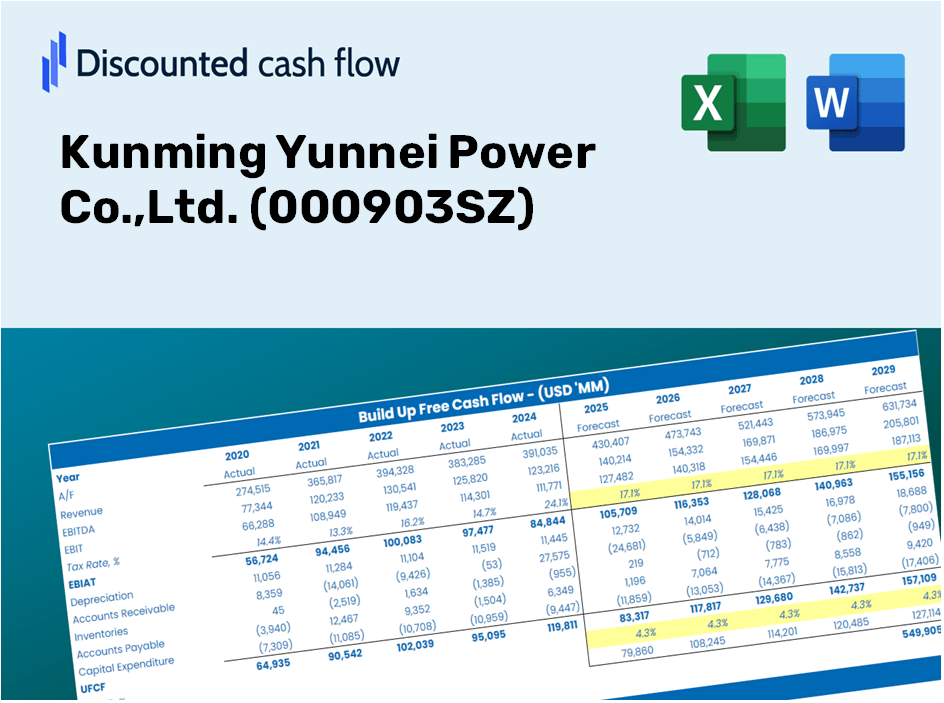
Kunming Yunnei Power Co.,Ltd. (000903.SZ) DCF Valuation |
Fully Editable: Tailor To Your Needs In Excel Or Sheets
Professional Design: Trusted, Industry-Standard Templates
Investor-Approved Valuation Models
MAC/PC Compatible, Fully Unlocked
No Expertise Is Needed; Easy To Follow
Kunming Yunnei Power Co.,Ltd. (000903.SZ) Bundle
Gain insight into your Kunming Yunnei Power Co.,Ltd. (000903SZ) valuation analysis with our state-of-the-art DCF Calculator! This Excel template comes preloaded with authentic (000903SZ) data, enabling you to adjust forecasts and assumptions to accurately determine the intrinsic value of Kunming Yunnei Power Co.,Ltd.
Discounted Cash Flow (DCF) - (USD MM)
| Year | AY1 2020 |
AY2 2021 |
AY3 2022 |
AY4 2023 |
AY5 2024 |
FY1 2025 |
FY2 2026 |
FY3 2027 |
FY4 2028 |
FY5 2029 |
|---|---|---|---|---|---|---|---|---|---|---|
| Revenue | 10,008.7 | 8,029.6 | 4,790.2 | 5,316.8 | 4,731.4 | 4,020.1 | 3,415.7 | 2,902.2 | 2,465.9 | 2,095.2 |
| Revenue Growth, % | 0 | -19.77 | -40.34 | 10.99 | -11.01 | -15.03 | -15.03 | -15.03 | -15.03 | -15.03 |
| EBITDA | 686.2 | 550.2 | -740.7 | -695.9 | -557.3 | -214.0 | -181.9 | -154.5 | -131.3 | -111.6 |
| EBITDA, % | 6.86 | 6.85 | -15.46 | -13.09 | -11.78 | -5.32 | -5.32 | -5.32 | -5.32 | -5.32 |
| Depreciation | 286.8 | 361.1 | 371.9 | 419.6 | 447.9 | 261.2 | 221.9 | 188.6 | 160.2 | 136.1 |
| Depreciation, % | 2.87 | 4.5 | 7.76 | 7.89 | 9.47 | 6.5 | 6.5 | 6.5 | 6.5 | 6.5 |
| EBIT | 399.4 | 189.1 | -1,112.5 | -1,115.4 | -1,005.1 | -475.2 | -403.8 | -343.1 | -291.5 | -247.7 |
| EBIT, % | 3.99 | 2.35 | -23.23 | -20.98 | -21.24 | -11.82 | -11.82 | -11.82 | -11.82 | -11.82 |
| Total Cash | 3,357.1 | 2,432.6 | 1,010.6 | 1,679.9 | 1,975.5 | 1,272.6 | 1,081.3 | 918.7 | 780.6 | 663.3 |
| Total Cash, percent | .0 | .0 | .0 | .0 | .0 | .0 | .0 | .0 | .0 | .0 |
| Account Receivables | 3,650.9 | 2,673.7 | 2,792.3 | 2,357.7 | 1,559.2 | 1,651.2 | 1,402.9 | 1,192.0 | 1,012.8 | 860.6 |
| Account Receivables, % | 36.48 | 33.3 | 58.29 | 44.34 | 32.95 | 41.07 | 41.07 | 41.07 | 41.07 | 41.07 |
| Inventories | 1,641.4 | 2,407.0 | 2,715.8 | 2,595.9 | 1,914.9 | 1,546.7 | 1,314.1 | 1,116.6 | 948.7 | 806.1 |
| Inventories, % | 16.4 | 29.98 | 56.69 | 48.82 | 40.47 | 38.47 | 38.47 | 38.47 | 38.47 | 38.47 |
| Accounts Payable | 7,279.2 | 6,537.7 | 6,112.2 | 4,698.2 | 2,386.3 | 3,159.4 | 2,684.4 | 2,280.9 | 1,938.0 | 1,646.6 |
| Accounts Payable, % | 72.73 | 81.42 | 127.6 | 88.37 | 50.44 | 78.59 | 78.59 | 78.59 | 78.59 | 78.59 |
| Capital Expenditure | -288.4 | -456.7 | -248.1 | -291.7 | -276.9 | -201.7 | -171.4 | -145.6 | -123.7 | -105.1 |
| Capital Expenditure, % | -2.88 | -5.69 | -5.18 | -5.49 | -5.85 | -5.02 | -5.02 | -5.02 | -5.02 | -5.02 |
| Tax Rate, % | -0.44558 | -0.44558 | -0.44558 | -0.44558 | -0.44558 | -0.44558 | -0.44558 | -0.44558 | -0.44558 | -0.44558 |
| EBITAT | 379.5 | 240.3 | -1,121.6 | -1,130.2 | -1,009.6 | -470.5 | -399.7 | -339.6 | -288.6 | -245.2 |
| Depreciation | ||||||||||
| Changes in Account Receivables | ||||||||||
| Changes in Inventories | ||||||||||
| Changes in Accounts Payable | ||||||||||
| Capital Expenditure | ||||||||||
| UFCF | 2,364.8 | -385.2 | -1,850.8 | -1,861.7 | -1,671.0 | 638.3 | -343.4 | -291.8 | -247.9 | -210.7 |
| WACC, % | 4.86 | 4.96 | 4.96 | 4.96 | 4.96 | 4.94 | 4.94 | 4.94 | 4.94 | 4.94 |
| PV UFCF | ||||||||||
| SUM PV UFCF | -326.1 | |||||||||
| Long Term Growth Rate, % | 2.00 | |||||||||
| Free cash flow (T + 1) | -215 | |||||||||
| Terminal Value | -7,310 | |||||||||
| Present Terminal Value | -5,744 | |||||||||
| Enterprise Value | -6,070 | |||||||||
| Net Debt | 3,576 | |||||||||
| Equity Value | -9,646 | |||||||||
| Diluted Shares Outstanding, MM | 1,932 | |||||||||
| Equity Value Per Share | -4.99 |
Benefits You Will Receive
- Adjustable Forecast Variables: Effortlessly modify key parameters (growth %, margins, WACC) to produce various scenarios.
- Company-Specific Data: Kunming Yunnei Power Co., Ltd.'s financial information pre-loaded to facilitate your analysis.
- Instant DCF Calculations: The template automatically computes Net Present Value (NPV) and intrinsic value for your convenience.
- Professional and Tailored: A refined Excel model designed to meet your valuation requirements.
- Designed for Analysts and Investors: Perfect for evaluating projections, verifying strategies, and enhancing efficiency.
Key Features
- Pre-Loaded Data: Historical financial statements and pre-filled forecasts for Kunming Yunnei Power Co., Ltd. (000903SZ).
- Fully Adjustable Inputs: Customize WACC, tax rates, revenue growth, and EBITDA margins to suit your analysis.
- Instant Results: View the intrinsic value of Kunming Yunnei Power Co., Ltd. (000903SZ) recalculated in real time.
- Clear Visual Outputs: Dashboard charts provide clear displays of valuation results and essential metrics.
- Built for Accuracy: A professional-grade tool designed for analysts, investors, and finance professionals.
How It Functions
- Download: Obtain the pre-prepared Excel file featuring Kunming Yunnei Power Co., Ltd.'s (000903SZ) financial data.
- Customize: Modify projections, including revenue growth, EBITDA %, and WACC to suit your analysis.
- Automatic Updates: The intrinsic value and NPV calculations refresh automatically in real-time.
- Scenario Testing: Generate various projections and instantly compare the results.
- Make Informed Decisions: Utilize the valuation findings to inform your investment approach.
Why Choose This Calculator for Kunming Yunnei Power Co., Ltd. (000903SZ)?
- All-in-One Solution: Features DCF, WACC, and comprehensive financial ratio analyses in a single tool.
- Flexible Inputs: Modify the yellow-highlighted cells to explore different scenarios.
- In-Depth Analysis: Automatically computes Kunming Yunnei's intrinsic value and Net Present Value.
- Ready-to-Use Data: Historical and projected data provide reliable starting points for your assessments.
- High-Quality Output: Perfect for financial analysts, investors, and business consultants focused on (000903SZ).
Who Can Benefit from This Product?
- Professional Investors: Create in-depth and trustworthy valuation models for analyzing investments in Kunming Yunnei Power Co., Ltd. (000903SZ).
- Corporate Finance Teams: Evaluate various valuation scenarios to inform strategic decisions within the organization.
- Consultants and Advisors: Deliver precise valuation insights to clients interested in Kunming Yunnei Power Co., Ltd. (000903SZ).
- Students and Educators: Utilize real-world financial data to enhance learning and practice in financial modeling.
- Energy Sector Enthusiasts: Gain a comprehensive understanding of how companies like Kunming Yunnei Power Co., Ltd. (000903SZ) are valued in the energy market.
Contents of the Template
- Historical Data: Contains Kunming Yunnei Power Co., Ltd.'s (000903SZ) previous financial performance and foundational forecasts.
- DCF and Levered DCF Models: Comprehensive templates for assessing the intrinsic value of Kunming Yunnei Power Co., Ltd. (000903SZ).
- WACC Sheet: Pre-configured calculations for the Weighted Average Cost of Capital.
- Editable Inputs: Customize essential drivers such as growth rates, EBITDA percentages, and CAPEX assumptions.
- Quarterly and Annual Statements: A thorough analysis of Kunming Yunnei Power Co., Ltd.'s (000903SZ) financial reports.
- Interactive Dashboard: Dynamic visualization of valuation outcomes and forecasts.
Disclaimer
All information, articles, and product details provided on this website are for general informational and educational purposes only. We do not claim any ownership over, nor do we intend to infringe upon, any trademarks, copyrights, logos, brand names, or other intellectual property mentioned or depicted on this site. Such intellectual property remains the property of its respective owners, and any references here are made solely for identification or informational purposes, without implying any affiliation, endorsement, or partnership.
We make no representations or warranties, express or implied, regarding the accuracy, completeness, or suitability of any content or products presented. Nothing on this website should be construed as legal, tax, investment, financial, medical, or other professional advice. In addition, no part of this site—including articles or product references—constitutes a solicitation, recommendation, endorsement, advertisement, or offer to buy or sell any securities, franchises, or other financial instruments, particularly in jurisdictions where such activity would be unlawful.
All content is of a general nature and may not address the specific circumstances of any individual or entity. It is not a substitute for professional advice or services. Any actions you take based on the information provided here are strictly at your own risk. You accept full responsibility for any decisions or outcomes arising from your use of this website and agree to release us from any liability in connection with your use of, or reliance upon, the content or products found herein.