
|
Zheshang Development Group Co., Ltd (000906.SZ) DCF Valuation |
Fully Editable: Tailor To Your Needs In Excel Or Sheets
Professional Design: Trusted, Industry-Standard Templates
Investor-Approved Valuation Models
MAC/PC Compatible, Fully Unlocked
No Expertise Is Needed; Easy To Follow
Zheshang Development Group Co., Ltd (000906.SZ) Bundle
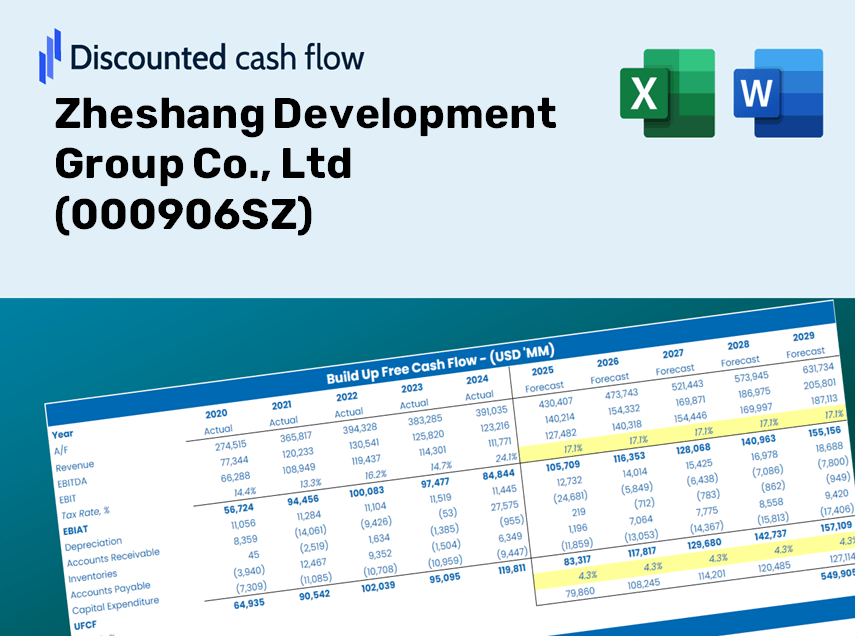
Gain insight into your Zheshang Development Group Co., Ltd (000906SZ) valuation analysis using our sophisticated DCF Calculator! This Excel template comes preloaded with real (000906SZ) data, enabling you to adjust forecasts and assumptions to accurately determine the intrinsic value of Zheshang Development Group Co., Ltd.
Discounted Cash Flow (DCF) - (USD MM)
| Year | AY1 2020 |
AY2 2021 |
AY3 2022 |
AY4 2023 |
AY5 2024 |
FY1 2025 |
FY2 2026 |
FY3 2027 |
FY4 2028 |
FY5 2029 |
|---|---|---|---|---|---|---|---|---|---|---|
| Revenue | 108,976.5 | 178,270.2 | 193,604.8 | 203,064.5 | 201,901.0 | 201,634.8 | 201,573.7 | 201,559.6 | 201,556.4 | 201,555.6 |
| Revenue Growth, % | 0 | 63.59 | 8.6 | 4.89 | -0.57297 | -0.13183 | -0.03033006 | -0.00697819 | -0.00160551 | -0.000369386617 |
| EBITDA | 1,498.6 | 1,973.4 | 2,258.7 | 1,982.4 | 1,311.1 | 2,127.0 | 2,126.4 | 2,126.2 | 2,126.2 | 2,126.2 |
| EBITDA, % | 1.38 | 1.11 | 1.17 | 0.97624 | 0.64939 | 1.05 | 1.05 | 1.05 | 1.05 | 1.05 |
| Depreciation | 54.7 | 97.3 | 125.5 | 128.6 | 167.6 | 182.3 | 197.3 | 212.2 | 227.2 | 242.2 |
| Depreciation, % | 0.05018414 | 0.05458265 | 0.06483266 | 0.06334023 | 0.08298967 | 0.09042497 | 0.09785972 | 0.10529 | 0.11273 | 0.12016 |
| EBIT | 1,443.9 | 1,876.1 | 2,133.2 | 1,853.8 | 1,143.6 | 1,999.6 | 1,999.0 | 1,998.8 | 1,998.8 | 1,998.8 |
| EBIT, % | 1.32 | 1.05 | 1.1 | 0.9129 | 0.5664 | 0.99169 | 0.99169 | 0.99169 | 0.99169 | 0.99169 |
| Total Cash | 3,908.0 | 6,335.7 | 5,705.2 | 6,413.1 | 5,631.2 | 6,466.1 | 6,464.1 | 6,463.6 | 6,463.5 | 6,463.5 |
| Total Cash, percent | .0 | .0 | .0 | .0 | .0 | .0 | .0 | .0 | .0 | .0 |
| Account Receivables | 4,920.1 | 4,759.2 | 4,386.6 | 6,370.9 | 9,119.7 | 9,201.2 | 9,291.9 | 9,384.8 | 9,478.0 | 9,571.3 |
| Account Receivables, % | 4.51 | 2.67 | 2.27 | 3.14 | 4.52 | 4.56 | 4.61 | 4.66 | 4.7 | 4.75 |
| Inventories | 4,586.0 | 5,097.0 | 5,247.4 | 10,407.8 | 10,569.6 | 11,416.6 | 12,270.0 | 13,122.0 | 13,970.9 | 14,816.0 |
| Inventories, % | 4.21 | 2.86 | 2.71 | 5.13 | 5.24 | 5.66 | 6.09 | 6.51 | 6.93 | 7.35 |
| Accounts Payable | 5,359.1 | 8,476.7 | 6,489.8 | 10,097.5 | 10,657.4 | 10,832.1 | 11,017.4 | 11,205.1 | 11,393.1 | 11,581.0 |
| Accounts Payable, % | 4.92 | 4.75 | 3.35 | 4.97 | 5.28 | 5.37 | 5.47 | 5.56 | 5.65 | 5.75 |
| Capital Expenditure | -254.8 | -206.1 | -514.9 | -488.5 | -309.7 | -407.0 | -406.9 | -406.9 | -406.9 | -406.9 |
| Capital Expenditure, % | -0.2338 | -0.11562 | -0.26597 | -0.24055 | -0.15338 | -0.20186 | -0.20186 | -0.20186 | -0.20186 | -0.20186 |
| Tax Rate, % | 53.99 | 53.99 | 53.99 | 53.99 | 53.99 | 53.99 | 53.99 | 53.99 | 53.99 | 53.99 |
| EBITAT | 974.7 | 1,194.6 | 1,242.4 | 870.4 | 526.1 | 1,129.3 | 1,129.0 | 1,128.9 | 1,128.9 | 1,128.9 |
| Depreciation | ||||||||||
| Changes in Account Receivables | ||||||||||
| Changes in Inventories | ||||||||||
| Changes in Accounts Payable | ||||||||||
| Capital Expenditure | ||||||||||
| UFCF | -3,372.4 | 3,853.3 | -911.7 | -3,026.5 | -1,966.7 | 150.8 | 160.5 | 177.0 | 195.1 | 213.7 |
| WACC, % | 6.37 | 6.18 | 5.9 | 5.34 | 5.29 | 5.81 | 5.81 | 5.81 | 5.81 | 5.81 |
| PV UFCF | ||||||||||
| SUM PV UFCF | 752.0 | |||||||||
| Long Term Growth Rate, % | 3.00 | |||||||||
| Free cash flow (T + 1) | 220 | |||||||||
| Terminal Value | 7,818 | |||||||||
| Present Terminal Value | 5,893 | |||||||||
| Enterprise Value | 6,645 | |||||||||
| Net Debt | 1,337 | |||||||||
| Equity Value | 5,308 | |||||||||
| Diluted Shares Outstanding, MM | 820 | |||||||||
| Equity Value Per Share | 6.48 |
What You Will Receive
- Genuine Zheshang Data: Comprehensive financial information – from revenue to EBIT – based on real and projected statistics for Zheshang Development Group Co., Ltd (000906SZ).
- Complete Customization: Modify all essential parameters (yellow cells) such as WACC, growth %, and tax rates to suit your analysis.
- Real-Time Valuation Adjustments: Automatic recalculations to evaluate the effects of changes on the fair value of Zheshang Development Group Co., Ltd (000906SZ).
- Flexible Excel Template: Designed for quick modifications, scenario exploration, and in-depth forecasts.
- Efficient and Accurate: Eliminate the need to construct models from the ground up while ensuring accuracy and adaptability.
Key Features
- Customizable Financial Inputs: Adjust essential parameters such as revenue growth, EBITDA percentage, and capital expenditures tailored for Zheshang Development Group Co., Ltd (000906SZ).
- Instant DCF Valuation: Automatically computes intrinsic value, NPV, and other vital financial metrics in real-time.
- High-Precision Accuracy: Leverages Zheshang Development Group Co., Ltd (000906SZ)'s actual financial data for dependable valuation results.
- Effortless Scenario Analysis: Explore various assumptions and effortlessly compare potential outcomes.
- Efficiency Boosting Tool: Streamlines the process, removing the necessity of constructing intricate valuation models from scratch.
How It Functions
- Download: Obtain the pre-configured Excel file featuring Zheshang Development Group Co., Ltd’s (000906SZ) financial data.
- Customize: Tailor your forecasts, adjusting parameters such as revenue growth, EBITDA %, and WACC.
- Real-Time Updates: The intrinsic value and NPV calculations refresh automatically.
- Scenario Testing: Generate various projections and instantly evaluate different outcomes.
- Informed Decisions: Leverage the valuation results to shape your investment approach.
Why Opt for This Calculator?
- All-in-One Solution: Features DCF, WACC, and financial ratio analysis for complete evaluation.
- Adjustable Parameters: Modify the highlighted cells to explore different financial scenarios.
- In-Depth Analysis: Automatically computes the intrinsic value and Net Present Value for Zheshang Development Group Co., Ltd (000906SZ).
- Ready-to-Use Data: Comes with historical and projected data for reliable calculations.
- Expert-Level Accuracy: Perfect for financial analysts, investors, and business advisors.
Who Can Benefit from This Product?
- Individual Investors: Gain insights for making informed choices regarding investments in Zheshang Development Group Co., Ltd (000906SZ).
- Financial Analysts: Improve efficiency in valuation tasks with comprehensive financial models tailored for Zheshang Development Group Co., Ltd (000906SZ).
- Consultants: Provide clients with precise and timely valuation analyses of Zheshang Development Group Co., Ltd (000906SZ).
- Business Owners: Learn how major firms like Zheshang Development Group Co., Ltd (000906SZ) are valued to inform your strategic planning.
- Finance Students: Develop your understanding of valuation methods using real-world examples and data from Zheshang Development Group Co., Ltd (000906SZ).
Contents of the Template
- Preloaded ZHESHANG Data: Historical and forecasted financial metrics, including revenue, EBIT, and capital expenditures.
- DCF and WACC Models: Advanced sheets designed for calculating intrinsic value and the Weighted Average Cost of Capital.
- Editable Inputs: Yellow-highlighted cells for modifying revenue growth, tax rates, and discount rates.
- Financial Statements: Detailed annual and quarterly financials for in-depth analysis.
- Key Ratios: Metrics on profitability, leverage, and efficiency to assess performance.
- Dashboard and Charts: Visual representations of valuation results and underlying assumptions.
Disclaimer
All information, articles, and product details provided on this website are for general informational and educational purposes only. We do not claim any ownership over, nor do we intend to infringe upon, any trademarks, copyrights, logos, brand names, or other intellectual property mentioned or depicted on this site. Such intellectual property remains the property of its respective owners, and any references here are made solely for identification or informational purposes, without implying any affiliation, endorsement, or partnership.
We make no representations or warranties, express or implied, regarding the accuracy, completeness, or suitability of any content or products presented. Nothing on this website should be construed as legal, tax, investment, financial, medical, or other professional advice. In addition, no part of this site—including articles or product references—constitutes a solicitation, recommendation, endorsement, advertisement, or offer to buy or sell any securities, franchises, or other financial instruments, particularly in jurisdictions where such activity would be unlawful.
All content is of a general nature and may not address the specific circumstances of any individual or entity. It is not a substitute for professional advice or services. Any actions you take based on the information provided here are strictly at your own risk. You accept full responsibility for any decisions or outcomes arising from your use of this website and agree to release us from any liability in connection with your use of, or reliance upon, the content or products found herein.