
|
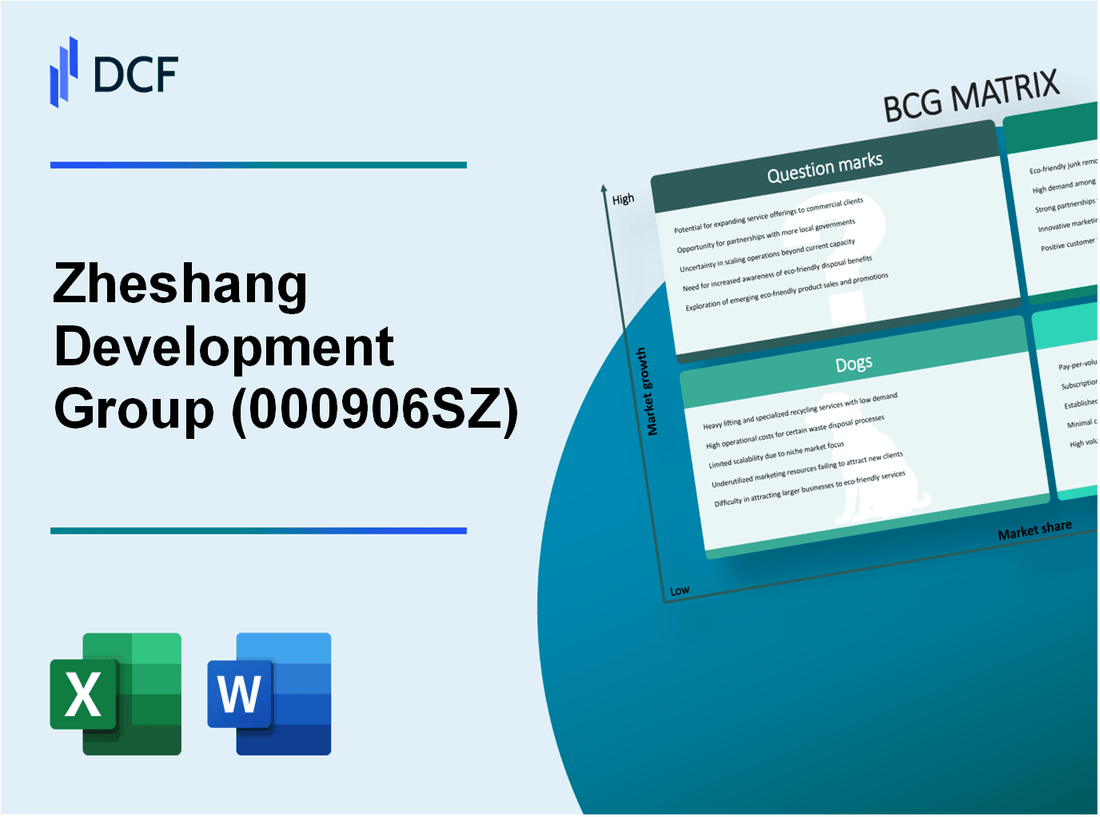
Zheshang Development Group Co., Ltd (000906.SZ): BCG Matrix [Apr-2026 Updated] |
Fully Editable: Tailor To Your Needs In Excel Or Sheets
Professional Design: Trusted, Industry-Standard Templates
Investor-Approved Valuation Models
MAC/PC Compatible, Fully Unlocked
No Expertise Is Needed; Easy To Follow
Zheshang Development Group Co., Ltd (000906.SZ) Bundle
Zheshang Development sits on a potent cash engine-large-scale steel and auto services generating steady liquidity-that's funding a decisive pivot into high-growth stars (new-energy supply chains and scalable digital platforms) while selectively investing in question marks (international logistics and green-chem ventures) that need heavy CAPEX to prove themselves; legacy taxis and small property assets look like divestment candidates, so capital-allocation choices now will determine whether the group successfully transforms into a greener, tech-driven industrial champion-read on to see where management must double down or trim.
Zheshang Development Group Co., Ltd (000906.SZ) - BCG Matrix Analysis: Stars
Stars
New energy supply chain services are classified as Stars due to high market growth and rising relative market share within the group's portfolio. In the first three quarters of 2025 this segment generated operating revenue of 8.5 billion yuan, driven by rapid expansion in photovoltaic (PV) materials, energy storage, and lithium battery trading. The group's lithium carbonate trading volume reached approximately 8,000 tons per month by late 2025 (about 96,000 tons annually), positioning the company among the leading domestic traders in a market experiencing double‑digit growth.
| Metric | Value | Notes/Implication |
|---|---|---|
| Q1-Q3 2025 Revenue (New Energy Supply Chain) | 8.5 billion yuan | Represents ~4.99% of group revenue (170.6 billion yuan for Q1-Q3 2025) |
| Lithium carbonate trading volume (late 2025) | 8,000 tons/month (≈96,000 tons/year) | Substantial scale supports pricing leverage and supply contracts |
| Two‑wheel battery swapping coverage | 31 cities | Rapid urban roll‑out into high‑growth mobility segment |
| Market growth (energy storage & PV materials) | Double‑digit annual growth | Favorable industry tailwinds |
| Group CAPEX allocation (est.) | Significant proportion toward new energy | Ongoing investments expected to lift revenue contribution |
- Scale and throughput: 8,000 t/month lithium carbonate throughput supports downstream integration and improved gross margins via bulk procurement and distribution contracts.
- Geographic expansion: 31 cities for two‑wheel battery swapping establishes network effects and recurring revenue from swap services and battery-as-a-service (BaaS) models.
- CAPEX strategy: Directed capital expenditures into PV, energy storage, and swapping infrastructure accelerate market share gains versus competitors.
Integrated supply chain finance and digital platform operations also qualify as Stars given high growth and strong relative market position. The group's intelligent operation strategy has supported total group revenue of 170.6 billion yuan for the first three quarters of 2025, with the digital and supply chain service segment contributing materially to year‑over‑year expansion and margin improvement.
| Metric | Value | Notes/Implication |
|---|---|---|
| Total group revenue (Q1-Q3 2025) | 170.6 billion yuan | Base for assessing segment contribution and scale |
| Digital/supply chain revenue growth | 15.90% YoY | Reflects ROI from digital infrastructure and operational efficiency gains |
| Operational model | Three‑in‑one (chain operation, logistics, e‑commerce) | Captures upstream and downstream value; enhances cross‑sell |
| Geographic reach (digital platform) | 20 provinces (as of Dec 2025) | Scalable customer base across industrial regions |
| Ownership/support | State‑owned via Zhejiang Communications Investment Group | Competitive advantages in credit, large contracts, and policy alignment |
- High ROI drivers: automation, inventory optimization, and integrated logistics reduce working capital and boost turnover.
- Market position: leading share in specialized industrial supply chain supported by state‑enterprise backing strengthens barriers to entry.
- Platform scaling: expansion across 20 provinces enables network growth effects, higher ARPU per customer, and improved unit economics.
Key quantitative indicators underscore Star status: new energy segment revenue of 8.5 billion yuan within a 170.6 billion yuan group (≈5% share) with 15.90% YoY growth in digital/supply chain operations, lithium carbonate throughput at ~96,000 t/year, and two‑wheel swapping presence in 31 cities. Continued CAPEX focus and platform investment are expected to elevate both revenue share and relative market share in high‑growth markets aligned with China's green energy transition.
Zheshang Development Group Co., Ltd (000906.SZ) - BCG Matrix Analysis: Cash Cows
Cash Cows
Bulk commodity trading in steel and metallurgical raw materials remains the primary revenue driver with dominant market share. This segment is a cornerstone of the business, contributing to a trailing 12-month revenue of approximately $31.2 billion as of September 2025. The global steel market in which this unit operates is mature, with an estimated CAGR of 3.0%; domestically the group maintains a leading position in wholesale metal materials and ores. Gross profit margin for this high-volume business stands at roughly 1.12%, reflecting the low-margin, high-turnover nature of commodity trading. Cash flow from this segment is consistently high, providing liquidity to fund expansion into new energy and technology sectors. The segment's stability is further evidenced by the group's inclusion in the Forbes Global 2000 list, ranked #445 in sales globally for 2025.
Automobile sales and after-sales services in Zhejiang provide a steady, reliable stream of income. Operating in a mature regional market, the group's integrated model-sales, repair, and taxi services-delivers consistent return on investment and supports high-quality asset management. This unit contributes to the group's overall profitability with the consolidated net income reported at 190 million yuan in the first three quarters of 2025. Capital expenditure requirements for the automotive segment are relatively low compared with the capital-intensive new energy business, allowing the unit to act as an internal funding source and diversification buffer against commodity price volatility.
Key quantitative snapshot of Cash Cow segments:
| Segment | Trailing 12M Revenue | Relative Market Position | Gross Profit Margin | Market Growth (CAGR) | Notable Financial Contribution | External Recognition |
|---|---|---|---|---|---|---|
| Bulk commodity trading (steel & metallurgical raw materials) | $31.2 billion (T-12, Sep 2025) | Dominant domestic wholesale market share | ~1.12% | ~3.0% (global steel market) | Consistent high cash flow; primary liquidity source | Forbes Global 2000 - Sales rank #445 (2025) |
| Automobile sales & after-sales (Zhejiang) | Not disclosed (stable regional revenues) | Strong regional brand presence and network | Higher margin profile than commodities (not disclosed) | Mature/stable market (low single-digit growth) | Contributes to group net income (190 million yuan, Q1-Q3 2025) | Recognized for service network and asset management |
Operational characteristics and strategic role:
- High cash generation: Commodity trading funds corporate investments and supports CAPEX in new energy and technology ventures.
- Low margin, high turnover: The bulk trading business relies on scale; profitability sensitive to commodity price spreads and logistics costs.
- Stability through diversification: Automotive services offer recurring revenue and lower CAPEX intensity, offsetting cyclicality in commodities.
- Capital allocation priority: Cash cow cash flows are prioritized for strategic growth projects while maintaining working capital for trading operations.
Risks and operational pressures specific to cash cows:
- Margin compression risk if commodity spreads narrow or if competition intensifies in domestic wholesale channels.
- Exposure to global steel cycle: even modest negative shifts in demand or oversupply can materially affect cash generation.
- Operational leverage: small percentage margin declines on $31.2 billion in revenue have large absolute profit/cashflow impacts.
- Regulatory and trade-policy volatility affecting import/export flows of metal ores and finished products.
Zheshang Development Group Co., Ltd (000906.SZ) - BCG Matrix Analysis: Question Marks
Question Marks - International expansion and cross-border supply chain services are high-potential ventures currently requiring significant capital injection. The group is actively establishing new platform companies in strategic global locations (Southeast Asia, Middle East, Eastern Europe) to broaden its reach beyond the domestic Chinese market. The global logistics market is projected to reach $8.07 trillion by 2033 with a 4.02% CAGR; Zheshang's international market share remains in the early development stage, estimated at 0.05%-0.15% in targeted corridors as of late-2025 initial deployment.
Initial investments in overseas logistics hubs, local warehousing, and trading offices have resulted in temporary pressure on consolidated net profit margins, which stood at 0.18% on a TTM basis in late 2025. The success of this segment depends on navigating complex trade regulations, customs compliance, and competing with established global 3PL providers (e.g., DHL, Kuehne+Nagel). High CAPEX is required to build the necessary infrastructure and digital networks to support seamless cross-border operations, with estimated incremental CAPEX needs of RMB 1.2-2.0 billion over 2025-2027 for core markets.
Question Marks - Environmental technology and green chemical raw material trading represent speculative but fast-growing niches for the group. The company is investing RMB 200 million to establish joint ventures such as Zhongtuo Hexin to deepen its presence in the energy and chemical sectors. These sectors currently contribute a smaller percentage to total revenue (estimated 3%-6% of consolidated revenue in FY2025) but offer higher potential gross margins (target 8%-14%) compared with traditional steel trading (historical gross margins 4%-7%).
Current ROI for these new ventures is below the group average during the scale-up period; projected IRR for the green chemical and environmental tech initiatives is in the 6%-10% range over a 5-7 year horizon versus a historical group average ROIC of ~12% (pre-expansion). These initiatives are designed to future-proof the portfolio against shifting industrial demand toward carbon neutrality and regulatory-driven market growth, but the group's competitive position is still being established and will depend on technology partnerships, feedstock sourcing, and certification compliance.
Key quantitative summary for Question Marks:
| Metric | International Logistics | Environmental & Green Chemicals |
|---|---|---|
| Estimated Market Size (2025 base) | $8.07 trillion (global logistics market projection to 2033) | RMB 300-500 billion (regional sustainable materials market estimate) |
| Projected CAGR | 4.02% (global logistics long-term) | 7%-15% (sustainable industrial materials, region-dependent) |
| Group Investment (committed) | RMB 1.2-2.0 billion (2025-2027 CAPEX for hubs & platforms) | RMB 200 million (initial JV capital in Zhongtuo Hexin) |
| Current Group Revenue Contribution | Estimated 1%-3% (international operations early-stage) | 3%-6% (green chemicals & environmental tech) |
| TTM Net Profit Margin (late-2025) | 0.18% (group consolidated, pressure from investments) | Negative to low-single digits (initial JV phases) |
| Target Gross Margin Range | 3%-6% (scale-up target for logistics services) | 8%-14% (target for green chemical trading) |
| Projected ROI / IRR (5-7 years) | 6%-12% (dependent on market entry success) | 6%-10% (scale-up to profitability) |
| Primary Risks | Regulatory barriers, incumbent competition, FX volatility | Feedstock pricing, regulatory certification, technology risk |
Operational and strategic considerations:
- Scale and timing: Rapid CAPEX deployment required; delayed ramp leads to margin dilution and working capital strain.
- Regulatory complexity: Cross-border customs, tariffs, and environmental regulations increase compliance cost and time-to-market.
- Competitive dynamics: Competing against global 3PLs and established chemical traders necessitates differentiated value propositions (digital platforms, niche supply contracts).
- Supply chain resilience: Investments in multiple regional hubs improve resilience but raise fixed-cost base.
- Partnerships & M&A: Strategic alliances, JVs (e.g., Zhongtuo Hexin), and targeted M&A can accelerate market share gains with lower greenfield risk.
Zheshang Development Group Co., Ltd (000906.SZ) - BCG Matrix Analysis: Dogs
Dogs - Traditional taxi and legacy transportation services: traditional taxi operations and legacy transportation services within Zheshang Development show low relative market share versus digital ride-hailing platforms and participate in a low-growth market. Estimated annual revenue contribution from these legacy transport services is <1.5% of consolidated revenue (approx. RMB 50-120 million on a ~RMB 8-9 billion revenue base), while operating margins have compressed to single digits or negative in recent years due to price competition and rising fuel and maintenance costs.
Dogs - Market dynamics and operational pressure: market saturation and platform disintermediation have reduced pricing power. Passenger volumes have declined year-on-year by an estimated 6-12% over the past three years for legacy taxi fleets in the regions where Zheshang operates. Required CAPEX for fleet renewal and electrification is substantial relative to segment returns, with one-time replacement/electrification investment estimated at RMB 200-350 million to modernize a small-to-medium sized fleet (estimate based on average EV price and retrofitting costs).
Dogs - Strategic resource allocation: given the group's pivot toward intelligent operation and high-tech industrial supply chain services, the legacy taxi unit receives minimal capital allocation. Annual CAPEX to the segment is estimated at <0.5% of total corporate CAPEX (corporate CAPEX ~RMB 400-600 million annually), reflecting management deprioritization. The segment's ROI is materially below corporate WACC and underperforms core trading and new energy divisions.
Dogs - Small-scale property leasing and non-core hotel operations: small-property leasing and hotel assets are stagnant, representing an estimated 0.8-1.5% of total assets (part of the stated ~RMB 7.5 billion asset base). These assets generate modest rental and room revenue (combined estimated annual EBITDA RMB 20-60 million) and exhibit low growth and limited strategic fit with the group's supply chain and new energy focus.
Dogs - Financial snapshot (estimated metrics and rationale):
| Metric | Traditional Taxi / Legacy Transport | Small-scale Property / Hotel |
|---|---|---|
| Revenue contribution (annual) | RMB 50-120 million (<1.5% of group) | RMB 30-80 million (<1% of group) |
| Operating margin | -2% to 8% (pressure from costs) | 5% to 12% (low-margin, seasonal) |
| Estimated required CAPEX (one-time) | RMB 200-350 million (fleet electrification/upgrade) | RMB 30-80 million (refurbishment/compliance) |
| Share of total assets | ~1.0%-2.0% | ~0.8%-1.5% |
| Growth outlook | Low to negative (market share attrition) | Flat to low (local demand dependent) |
| Strategic fit with core | Poor (non-tech, labor intensive) | Poor (non-core property services) |
Dogs - Operational and strategic implications:
- High labor intensity and low automation potential increase per-unit cost and limit margin recovery.
- Electrification and regulatory compliance impose sizable capital and timeline risk compared with expected cash flow.
- Small property and hotel assets lack scale and synergies with supply chain logistics and new energy business lines.
- These assets are candidates for restructuring, asset-light transformation (e.g., management contracts, outsourcing), selective divestment, or targeted disposal to redeploy capital into higher-return segments.
Dogs - Management signals and likely actions: the group's stated objective of 'optimizing asset quality' and focus on 'intelligent operation' imply prioritization of capital toward high-growth, high-share businesses (trading, new energy, industrial services) and reduced support for these legacy/tail assets. Potential near-term actions include portfolio pruning (sale or JV), mothballing underperforming units, or conversion to asset-light frameworks; any retained operations will likely face strict KPI-driven performance targets and limited CAPEX.
Disclaimer
All information, articles, and product details provided on this website are for general informational and educational purposes only. We do not claim any ownership over, nor do we intend to infringe upon, any trademarks, copyrights, logos, brand names, or other intellectual property mentioned or depicted on this site. Such intellectual property remains the property of its respective owners, and any references here are made solely for identification or informational purposes, without implying any affiliation, endorsement, or partnership.
We make no representations or warranties, express or implied, regarding the accuracy, completeness, or suitability of any content or products presented. Nothing on this website should be construed as legal, tax, investment, financial, medical, or other professional advice. In addition, no part of this site—including articles or product references—constitutes a solicitation, recommendation, endorsement, advertisement, or offer to buy or sell any securities, franchises, or other financial instruments, particularly in jurisdictions where such activity would be unlawful.
All content is of a general nature and may not address the specific circumstances of any individual or entity. It is not a substitute for professional advice or services. Any actions you take based on the information provided here are strictly at your own risk. You accept full responsibility for any decisions or outcomes arising from your use of this website and agree to release us from any liability in connection with your use of, or reliance upon, the content or products found herein.