
|
Shandong Shanda Wit Science and Technology Co., Ltd. (000915.SZ) DCF Valuation |
Fully Editable: Tailor To Your Needs In Excel Or Sheets
Professional Design: Trusted, Industry-Standard Templates
Investor-Approved Valuation Models
MAC/PC Compatible, Fully Unlocked
No Expertise Is Needed; Easy To Follow
Shandong Shanda Wit Science and Technology Co., Ltd. (000915.SZ) Bundle
Explore the financial outlook of Shandong Shanda Wit Science and Technology Co., Ltd. (000915SZ) with our user-friendly DCF Calculator! Simply enter your projections for growth, margins, and expenses to determine the intrinsic value of Shandong Shanda Wit Science and Technology Co., Ltd. (000915SZ) and inform your investment decisions.
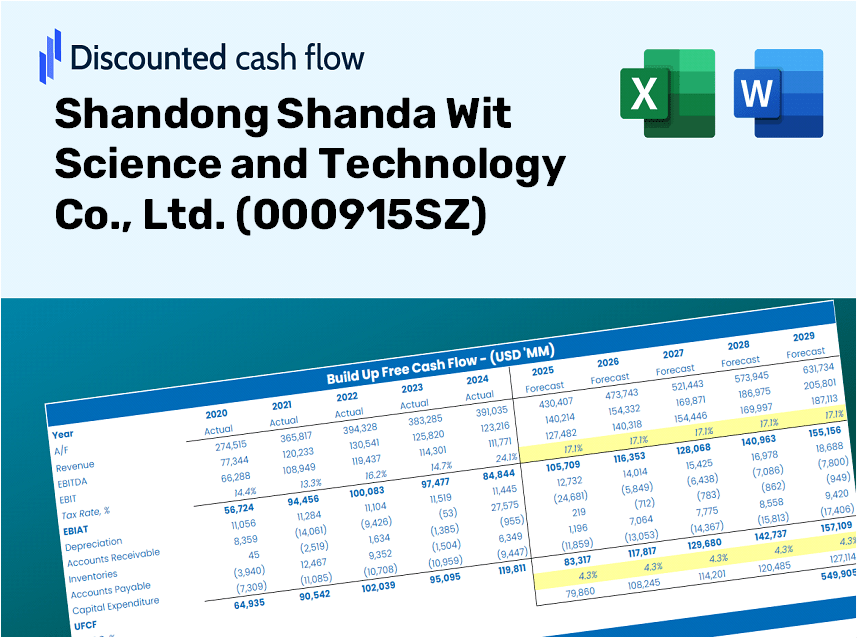
Discounted Cash Flow (DCF) - (USD MM)
| Year | AY1 2020 |
AY2 2021 |
AY3 2022 |
AY4 2023 |
AY5 2024 |
FY1 2025 |
FY2 2026 |
FY3 2027 |
FY4 2028 |
FY5 2029 |
|---|---|---|---|---|---|---|---|---|---|---|
| Revenue | 1,821.0 | 2,027.1 | 2,341.1 | 2,484.2 | 2,134.5 | 2,179.6 | 2,225.7 | 2,272.7 | 2,320.8 | 2,369.8 |
| Revenue Growth, % | 0 | 11.32 | 15.49 | 6.11 | -14.08 | 2.11 | 2.11 | 2.11 | 2.11 | 2.11 |
| EBITDA | 629.5 | 846.1 | 1,201.8 | 1,329.5 | 1,177.7 | 1,030.3 | 1,052.0 | 1,074.3 | 1,097.0 | 1,120.2 |
| EBITDA, % | 34.57 | 41.74 | 51.33 | 53.52 | 55.17 | 47.27 | 47.27 | 47.27 | 47.27 | 47.27 |
| Depreciation | 65.4 | 69.3 | 68.4 | 73.3 | 73.0 | 71.1 | 72.6 | 74.1 | 75.7 | 77.3 |
| Depreciation, % | 3.59 | 3.42 | 2.92 | 2.95 | 3.42 | 3.26 | 3.26 | 3.26 | 3.26 | 3.26 |
| EBIT | 564.1 | 776.9 | 1,133.4 | 1,256.2 | 1,104.7 | 959.2 | 979.5 | 1,000.2 | 1,021.3 | 1,042.9 |
| EBIT, % | 30.98 | 38.32 | 48.41 | 50.57 | 51.76 | 44.01 | 44.01 | 44.01 | 44.01 | 44.01 |
| Total Cash | 1,492.0 | 1,945.0 | 2,793.5 | 3,262.1 | 3,078.8 | 2,083.2 | 2,127.2 | 2,172.2 | 2,218.1 | 2,265.0 |
| Total Cash, percent | .0 | .0 | .0 | .0 | .0 | .0 | .0 | .0 | .0 | .0 |
| Account Receivables | 615.0 | 343.3 | 257.1 | 316.7 | 320.4 | 389.9 | 398.2 | 406.6 | 415.2 | 424.0 |
| Account Receivables, % | 33.77 | 16.93 | 10.98 | 12.75 | 15.01 | 17.89 | 17.89 | 17.89 | 17.89 | 17.89 |
| Inventories | 134.7 | 102.2 | 87.1 | 86.5 | 70.6 | 100.0 | 102.2 | 104.3 | 106.5 | 108.8 |
| Inventories, % | 7.4 | 5.04 | 3.72 | 3.48 | 3.31 | 4.59 | 4.59 | 4.59 | 4.59 | 4.59 |
| Accounts Payable | 185.1 | 70.6 | 40.7 | 32.2 | 25.8 | 78.0 | 79.6 | 81.3 | 83.0 | 84.8 |
| Accounts Payable, % | 10.17 | 3.48 | 1.74 | 1.3 | 1.21 | 3.58 | 3.58 | 3.58 | 3.58 | 3.58 |
| Capital Expenditure | -101.8 | -120.3 | -89.7 | -50.6 | -43.6 | -84.7 | -86.5 | -88.4 | -90.2 | -92.1 |
| Capital Expenditure, % | -5.59 | -5.94 | -3.83 | -2.04 | -2.04 | -3.89 | -3.89 | -3.89 | -3.89 | -3.89 |
| Tax Rate, % | 56.24 | 56.24 | 56.24 | 56.24 | 56.24 | 56.24 | 56.24 | 56.24 | 56.24 | 56.24 |
| EBITAT | 267.0 | 359.8 | 515.1 | 554.7 | 483.4 | 435.5 | 444.7 | 454.1 | 463.7 | 473.5 |
| Depreciation | ||||||||||
| Changes in Account Receivables | ||||||||||
| Changes in Inventories | ||||||||||
| Changes in Accounts Payable | ||||||||||
| Capital Expenditure | ||||||||||
| UFCF | -333.9 | 498.4 | 565.2 | 509.8 | 518.6 | 375.1 | 422.0 | 431.0 | 440.1 | 449.4 |
| WACC, % | 4.54 | 4.54 | 4.54 | 4.54 | 4.54 | 4.54 | 4.54 | 4.54 | 4.54 | 4.54 |
| PV UFCF | ||||||||||
| SUM PV UFCF | 1,850.8 | |||||||||
| Long Term Growth Rate, % | 0.50 | |||||||||
| Free cash flow (T + 1) | 452 | |||||||||
| Terminal Value | 11,192 | |||||||||
| Present Terminal Value | 8,965 | |||||||||
| Enterprise Value | 10,816 | |||||||||
| Net Debt | -2,119 | |||||||||
| Equity Value | 12,935 | |||||||||
| Diluted Shares Outstanding, MM | 234 | |||||||||
| Equity Value Per Share | 55.19 |
What You Will Receive
- Authentic Financial Data: Comprehensive preloaded figures – from revenue to EBIT – based on actual and anticipated performance.
- Comprehensive Customization: Modify essential parameters (yellow cells) such as WACC, growth %, and tax rates to fit your analysis.
- Immediate Valuation Adjustments: Automatic recalculations that allow for real-time analysis of changes on Shandong Shanda Wit Science and Technology Co., Ltd. (000915SZ)'s fair value.
- Flexible Excel Template: Designed for effortless updates, scenario analysis, and precise forecasting.
- Efficient and Reliable: Avoid starting from scratch with models while ensuring accuracy and adaptability.
Key Features
- Comprehensive DCF Calculator: Features detailed unlevered and levered DCF valuation models tailored for Shandong Shanda Wit Science and Technology Co., Ltd. (000915SZ).
- WACC Calculator: Comes with a pre-built Weighted Average Cost of Capital sheet that allows for customizable inputs.
- Adjustable Forecast Assumptions: Easily modify growth rates, capital expenditures, and discount rates to reflect your analysis.
- Integrated Financial Ratios: Evaluate profitability, leverage, and efficiency ratios specific to Shandong Shanda Wit Science and Technology Co., Ltd. (000915SZ).
- Interactive Dashboard and Charts: Visual outputs that present key valuation metrics for streamlined analysis.
How It Works
- 1. Open the Template: Download and launch the Excel file featuring Shandong Shanda Wit Science and Technology Co., Ltd.'s (000915SZ) preloaded data.
- 2. Edit Assumptions: Modify essential inputs such as growth rates, WACC, and capital expenditures.
- 3. View Results Instantly: The DCF model automatically calculates the intrinsic value and NPV for you.
- 4. Test Scenarios: Evaluate multiple forecasts to explore various valuation results.
- 5. Use with Confidence: Share professional valuation insights to bolster your decision-making process.
Why Choose This Calculator for Shandong Shanda Wit Science and Technology Co., Ltd. (000915SZ)?
- All-in-One Solution: Combines DCF, WACC, and financial ratio assessments in a single platform.
- Flexible Inputs: Modify the yellow-highlighted fields to explore different financial scenarios.
- In-Depth Analysis: Automatically computes the intrinsic value and Net Present Value for Shandong Shanda Wit Science and Technology Co., Ltd. (000915SZ).
- Preloaded Information: Historical and projected data provide reliable baselines for analysis.
- Industry Standard: Perfect for financial analysts, investors, and business consultants working with Shandong Shanda Wit Science and Technology Co., Ltd. (000915SZ).
Who Can Benefit from Our Solutions?
- Investors: Enhance your investment strategy with our advanced technology solutions.
- Financial Analysts: Streamline your analysis with our customizable financial models.
- Consultants: Easily tailor our tools for impactful client presentations or detailed reports.
- Finance Enthusiasts: Expand your knowledge of cutting-edge technology applications in finance.
- Educators and Students: Utilize our resources as practical aids in finance and technology courses.
Contents of the Template
- Detailed DCF Model: User-friendly template featuring extensive valuation calculations.
- Actual Financial Data: Shandong Shanda Wit Science and Technology Co., Ltd.'s historical and projected financials preloaded for analysis.
- Adjustable Variables: Modify WACC, growth rates, and tax assumptions to explore different scenarios.
- Financial Statements: Complete annual and quarterly reports for thorough insights.
- Critical Ratios: Integrated analysis for assessing profitability, efficiency, and leverage.
- Interactive Dashboard: Visual charts and tables to provide clear, actionable outcomes.
Disclaimer
All information, articles, and product details provided on this website are for general informational and educational purposes only. We do not claim any ownership over, nor do we intend to infringe upon, any trademarks, copyrights, logos, brand names, or other intellectual property mentioned or depicted on this site. Such intellectual property remains the property of its respective owners, and any references here are made solely for identification or informational purposes, without implying any affiliation, endorsement, or partnership.
We make no representations or warranties, express or implied, regarding the accuracy, completeness, or suitability of any content or products presented. Nothing on this website should be construed as legal, tax, investment, financial, medical, or other professional advice. In addition, no part of this site—including articles or product references—constitutes a solicitation, recommendation, endorsement, advertisement, or offer to buy or sell any securities, franchises, or other financial instruments, particularly in jurisdictions where such activity would be unlawful.
All content is of a general nature and may not address the specific circumstances of any individual or entity. It is not a substitute for professional advice or services. Any actions you take based on the information provided here are strictly at your own risk. You accept full responsibility for any decisions or outcomes arising from your use of this website and agree to release us from any liability in connection with your use of, or reliance upon, the content or products found herein.