
|
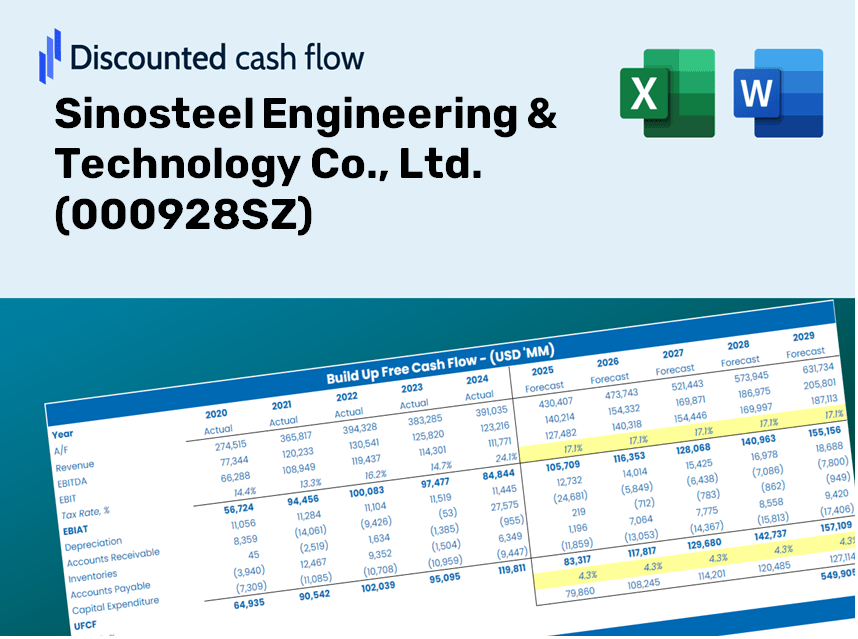
Sinosteel Engineering & Technology Co., Ltd. (000928.SZ) DCF Valuation |
Fully Editable: Tailor To Your Needs In Excel Or Sheets
Professional Design: Trusted, Industry-Standard Templates
Investor-Approved Valuation Models
MAC/PC Compatible, Fully Unlocked
No Expertise Is Needed; Easy To Follow
Sinosteel Engineering & Technology Co., Ltd. (000928.SZ) Bundle
Discover the true value of Sinosteel Engineering & Technology Co., Ltd. (000928SZ) with our advanced DCF Calculator! Adjust key assumptions, explore various scenarios, and assess how different changes affect the valuation of Sinosteel Engineering & Technology Co., Ltd. (000928SZ) – all within one convenient Excel template.
Discounted Cash Flow (DCF) - (USD MM)
| Year | AY1 2020 |
AY2 2021 |
AY3 2022 |
AY4 2023 |
AY5 2024 |
FY1 2025 |
FY2 2026 |
FY3 2027 |
FY4 2028 |
FY5 2029 |
|---|---|---|---|---|---|---|---|---|---|---|
| Revenue | 14,827.5 | 15,862.3 | 18,717.8 | 26,377.1 | 17,646.7 | 16,677.6 | 15,761.8 | 14,896.3 | 14,078.3 | 13,305.2 |
| Revenue Growth, % | 0 | 6.98 | 18 | 40.92 | -33.1 | -5.49 | -5.49 | -5.49 | -5.49 | -5.49 |
| EBITDA | 901.3 | 1,044.9 | 1,046.2 | 1,245.2 | 1,272.1 | 1,006.8 | 951.5 | 899.3 | 849.9 | 803.2 |
| EBITDA, % | 6.08 | 6.59 | 5.59 | 4.72 | 7.21 | 6.04 | 6.04 | 6.04 | 6.04 | 6.04 |
| Depreciation | 35.8 | 83.8 | 86.3 | 76.3 | 75.9 | 65.0 | 61.5 | 58.1 | 54.9 | 51.9 |
| Depreciation, % | 0.2413 | 0.5281 | 0.46102 | 0.28934 | 0.42984 | 0.38992 | 0.38992 | 0.38992 | 0.38992 | 0.38992 |
| EBIT | 865.5 | 961.1 | 959.9 | 1,168.9 | 1,196.2 | 941.8 | 890.1 | 841.2 | 795.0 | 751.3 |
| EBIT, % | 5.84 | 6.06 | 5.13 | 4.43 | 6.78 | 5.65 | 5.65 | 5.65 | 5.65 | 5.65 |
| Total Cash | 5,574.2 | 6,943.7 | 8,209.1 | 9,736.6 | 10,060.3 | 7,309.7 | 6,908.3 | 6,529.0 | 6,170.4 | 5,831.6 |
| Total Cash, percent | .0 | .0 | .0 | .0 | .0 | .0 | .0 | .0 | .0 | .0 |
| Account Receivables | 7,024.0 | 5,684.5 | 4,856.4 | 7,000.7 | 5,556.6 | 5,576.4 | 5,270.2 | 4,980.8 | 4,707.3 | 4,448.8 |
| Account Receivables, % | 47.37 | 35.84 | 25.95 | 26.54 | 31.49 | 33.44 | 33.44 | 33.44 | 33.44 | 33.44 |
| Inventories | 1,537.2 | 1,990.5 | 2,374.2 | 2,125.8 | 903.3 | 1,627.0 | 1,537.6 | 1,453.2 | 1,373.4 | 1,298.0 |
| Inventories, % | 10.37 | 12.55 | 12.68 | 8.06 | 5.12 | 9.76 | 9.76 | 9.76 | 9.76 | 9.76 |
| Accounts Payable | 7,945.5 | 10,275.8 | 11,553.1 | 15,005.5 | 13,380.4 | 10,433.6 | 9,860.6 | 9,319.2 | 8,807.4 | 8,323.8 |
| Accounts Payable, % | 53.59 | 64.78 | 61.72 | 56.89 | 75.82 | 62.56 | 62.56 | 62.56 | 62.56 | 62.56 |
| Capital Expenditure | -13.0 | -23.0 | -22.8 | -10.6 | -14.5 | -15.9 | -15.0 | -14.2 | -13.4 | -12.7 |
| Capital Expenditure, % | -0.08783588 | -0.1448 | -0.12166 | -0.04015844 | -0.08244385 | -0.09538021 | -0.09538021 | -0.09538021 | -0.09538021 | -0.09538021 |
| Tax Rate, % | 25.73 | 25.73 | 25.73 | 25.73 | 25.73 | 25.73 | 25.73 | 25.73 | 25.73 | 25.73 |
| EBITAT | 718.0 | 746.4 | 732.4 | 868.9 | 888.4 | 726.2 | 686.3 | 648.6 | 613.0 | 579.3 |
| Depreciation | ||||||||||
| Changes in Account Receivables | ||||||||||
| Changes in Inventories | ||||||||||
| Changes in Accounts Payable | ||||||||||
| Capital Expenditure | ||||||||||
| UFCF | 125.1 | 4,023.8 | 2,517.5 | 2,491.2 | 1,991.1 | -2,914.9 | 555.3 | 524.8 | 496.0 | 468.8 |
| WACC, % | 7.83 | 7.76 | 7.75 | 7.72 | 7.72 | 7.76 | 7.76 | 7.76 | 7.76 | 7.76 |
| PV UFCF | ||||||||||
| SUM PV UFCF | -1,116.9 | |||||||||
| Long Term Growth Rate, % | 3.00 | |||||||||
| Free cash flow (T + 1) | 483 | |||||||||
| Terminal Value | 10,150 | |||||||||
| Present Terminal Value | 6,986 | |||||||||
| Enterprise Value | 5,870 | |||||||||
| Net Debt | -9,301 | |||||||||
| Equity Value | 15,171 | |||||||||
| Diluted Shares Outstanding, MM | 1,435 | |||||||||
| Equity Value Per Share | 10.57 |
What You Will Receive
- Pre-Built Financial Model: Utilize Sinosteel Engineering & Technology Co., Ltd.'s actual data for accurate DCF valuation.
- Comprehensive Forecast Control: Modify revenue growth, profit margins, WACC, and other essential metrics.
- Real-Time Calculations: Immediate updates allow you to view results as you implement changes.
- Investor-Ready Template: A polished Excel file crafted for high-quality valuation purposes.
- Customizable and Repeatable: Designed for adaptability, enabling ongoing use for in-depth forecasts.
Key Features
- Comprehensive DCF Calculator: Offers detailed unlevered and levered DCF valuation models tailored for Sinosteel Engineering & Technology Co., Ltd. (000928SZ).
- WACC Calculator: Features a pre-configured Weighted Average Cost of Capital sheet with adjustable inputs for precise calculations.
- Customizable Forecast Assumptions: Easily adjust growth rates, capital expenditures, and discount rates to reflect your analysis.
- Integrated Financial Ratios: Evaluate profitability, leverage, and efficiency ratios specific to Sinosteel Engineering & Technology Co., Ltd. (000928SZ).
- Dashboard and Visual Analytics: Dynamic charts and visual summaries present critical valuation metrics for straightforward analysis.
How It Functions
- Download the Template: Gain immediate access to the Excel-based Sinosteel Engineering DCF Calculator.
- Input Your Assumptions: Modify the yellow-highlighted cells to set growth rates, WACC, margins, and additional factors.
- Instant Calculations: The model will automatically refresh to display Sinosteel Engineering's intrinsic value.
- Test Scenarios: Experiment with different assumptions to assess potential changes in valuation.
- Analyze and Decide: Utilize the outcomes to inform your investment or financial strategy.
Reasons to Select This Calculator for Sinosteel Engineering & Technology Co., Ltd. (000928SZ)
- All-in-One Solution: Features DCF, WACC, and financial ratio analyses seamlessly integrated.
- Flexible Inputs: Modify the yellow-highlighted fields to explore different financial scenarios.
- In-Depth Analysis: Automatically computes the intrinsic value and Net Present Value for Sinosteel (000928SZ).
- Loaded with Data: Incorporates both historical and projected data for reliable calculations.
- High-Quality Standards: Tailored for financial analysts, investors, and business advisors.
Who Can Benefit from Sinosteel Engineering & Technology Co., Ltd. (000928SZ)?
- Investors: Make informed investment choices backed by comprehensive analysis tools.
- Financial Analysts: Streamline your workflow with our customizable financial models.
- Consultants: Easily modify our templates for impactful client presentations and reports.
- Industry Enthusiasts: Enhance your knowledge of engineering and technology sectors through insightful case studies.
- Educators and Students: Utilize it as a valuable resource for practical learning in engineering and finance courses.
Contents of the Template
- Historical Data: Contains past financial records and baseline forecasts for Sinosteel Engineering & Technology Co., Ltd. (000928SZ).
- DCF and Levered DCF Models: Comprehensive templates designed to assess the intrinsic value of Sinosteel Engineering & Technology Co., Ltd. (000928SZ).
- WACC Sheet: Pre-configured calculations for the Weighted Average Cost of Capital specific to Sinosteel Engineering & Technology Co., Ltd. (000928SZ).
- Editable Inputs: Customize key drivers including growth rates, EBITDA percentages, and CAPEX assumptions for Sinosteel Engineering & Technology Co., Ltd. (000928SZ).
- Quarterly and Annual Statements: A thorough analysis of the financials for Sinosteel Engineering & Technology Co., Ltd. (000928SZ).
- Interactive Dashboard: Dynamically visualize valuation results and forecasts for Sinosteel Engineering & Technology Co., Ltd. (000928SZ).
Disclaimer
All information, articles, and product details provided on this website are for general informational and educational purposes only. We do not claim any ownership over, nor do we intend to infringe upon, any trademarks, copyrights, logos, brand names, or other intellectual property mentioned or depicted on this site. Such intellectual property remains the property of its respective owners, and any references here are made solely for identification or informational purposes, without implying any affiliation, endorsement, or partnership.
We make no representations or warranties, express or implied, regarding the accuracy, completeness, or suitability of any content or products presented. Nothing on this website should be construed as legal, tax, investment, financial, medical, or other professional advice. In addition, no part of this site—including articles or product references—constitutes a solicitation, recommendation, endorsement, advertisement, or offer to buy or sell any securities, franchises, or other financial instruments, particularly in jurisdictions where such activity would be unlawful.
All content is of a general nature and may not address the specific circumstances of any individual or entity. It is not a substitute for professional advice or services. Any actions you take based on the information provided here are strictly at your own risk. You accept full responsibility for any decisions or outcomes arising from your use of this website and agree to release us from any liability in connection with your use of, or reliance upon, the content or products found herein.