
|
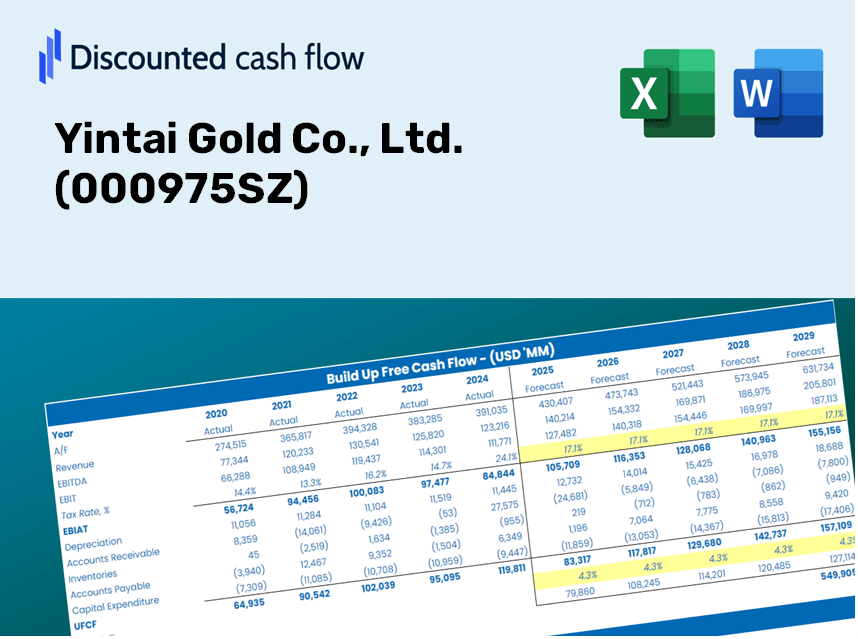
Yintai Gold Co., Ltd. (000975.SZ) DCF Valuation |
Fully Editable: Tailor To Your Needs In Excel Or Sheets
Professional Design: Trusted, Industry-Standard Templates
Investor-Approved Valuation Models
MAC/PC Compatible, Fully Unlocked
No Expertise Is Needed; Easy To Follow
Yintai Gold Co., Ltd. (000975.SZ) Bundle
Looking to calculate the intrinsic value of Yintai Gold Co., Ltd.? Our (000975SZ) DCF Calculator integrates real-world data with extensive customization features, allowing you to refine your forecasts and enhance your investment strategy.
Discounted Cash Flow (DCF) - (USD MM)
| Year | AY1 2020 |
AY2 2021 |
AY3 2022 |
AY4 2023 |
AY5 2024 |
FY1 2025 |
FY2 2026 |
FY3 2027 |
FY4 2028 |
FY5 2029 |
|---|---|---|---|---|---|---|---|---|---|---|
| Revenue | 7,905.8 | 9,040.2 | 8,381.5 | 8,105.7 | 13,585.4 | 16,009.6 | 18,866.3 | 22,232.8 | 26,200.0 | 30,875.1 |
| Revenue Growth, % | 0 | 14.35 | -7.29 | -3.29 | 67.6 | 17.84 | 17.84 | 17.84 | 17.84 | 17.84 |
| EBITDA | 2,368.5 | 2,623.1 | 2,760.1 | 2,947.3 | 3,855.6 | 5,015.7 | 5,910.7 | 6,965.4 | 8,208.3 | 9,673.0 |
| EBITDA, % | 29.96 | 29.02 | 32.93 | 36.36 | 28.38 | 31.33 | 31.33 | 31.33 | 31.33 | 31.33 |
| Depreciation | 661.2 | 805.5 | 1,172.4 | 935.7 | 607.8 | 1,513.8 | 1,784.0 | 2,102.3 | 2,477.4 | 2,919.5 |
| Depreciation, % | 8.36 | 8.91 | 13.99 | 11.54 | 4.47 | 9.46 | 9.46 | 9.46 | 9.46 | 9.46 |
| EBIT | 1,707.3 | 1,817.6 | 1,587.7 | 2,011.6 | 3,247.8 | 3,501.9 | 4,126.7 | 4,863.1 | 5,730.9 | 6,753.5 |
| EBIT, % | 21.6 | 20.11 | 18.94 | 24.82 | 23.91 | 21.87 | 21.87 | 21.87 | 21.87 | 21.87 |
| Total Cash | 2,017.9 | 3,529.7 | 3,874.4 | 4,082.1 | 4,127.0 | 6,132.8 | 7,227.1 | 8,516.7 | 10,036.4 | 11,827.3 |
| Total Cash, percent | .0 | .0 | .0 | .0 | .0 | .0 | .0 | .0 | .0 | .0 |
| Account Receivables | 69.2 | 122.2 | 102.1 | 42.0 | 106.9 | 152.1 | 179.2 | 211.2 | 248.8 | 293.3 |
| Account Receivables, % | 0.87476 | 1.35 | 1.22 | 0.51864 | 0.7866 | 0.94981 | 0.94981 | 0.94981 | 0.94981 | 0.94981 |
| Inventories | 1,027.0 | 1,028.3 | 1,359.0 | 1,484.6 | 1,240.1 | 2,178.1 | 2,566.7 | 3,024.7 | 3,564.4 | 4,200.5 |
| Inventories, % | 12.99 | 11.38 | 16.21 | 18.32 | 9.13 | 13.6 | 13.6 | 13.6 | 13.6 | 13.6 |
| Accounts Payable | 569.7 | 1,881.3 | 1,529.6 | 1,517.4 | 796.3 | 2,268.4 | 2,673.2 | 3,150.2 | 3,712.3 | 4,374.8 |
| Accounts Payable, % | 7.21 | 20.81 | 18.25 | 18.72 | 5.86 | 14.17 | 14.17 | 14.17 | 14.17 | 14.17 |
| Capital Expenditure | -603.6 | -718.4 | -608.6 | -614.8 | -687.8 | -1,136.4 | -1,339.2 | -1,578.1 | -1,859.7 | -2,191.6 |
| Capital Expenditure, % | -7.64 | -7.95 | -7.26 | -7.59 | -5.06 | -7.1 | -7.1 | -7.1 | -7.1 | -7.1 |
| Tax Rate, % | 31.53 | 31.53 | 31.53 | 31.53 | 31.53 | 31.53 | 31.53 | 31.53 | 31.53 | 31.53 |
| EBITAT | 1,204.5 | 1,254.7 | 1,108.4 | 1,373.7 | 2,223.9 | 2,424.4 | 2,857.0 | 3,366.8 | 3,967.5 | 4,675.5 |
| Depreciation | ||||||||||
| Changes in Account Receivables | ||||||||||
| Changes in Inventories | ||||||||||
| Changes in Accounts Payable | ||||||||||
| Capital Expenditure | ||||||||||
| UFCF | 735.6 | 2,599.0 | 1,010.0 | 1,616.8 | 1,602.5 | 3,290.8 | 3,290.8 | 3,878.0 | 4,569.9 | 5,385.4 |
| WACC, % | 4.61 | 4.61 | 4.61 | 4.61 | 4.61 | 4.61 | 4.61 | 4.61 | 4.61 | 4.61 |
| PV UFCF | ||||||||||
| SUM PV UFCF | 17,653.8 | |||||||||
| Long Term Growth Rate, % | 3.00 | |||||||||
| Free cash flow (T + 1) | 5,547 | |||||||||
| Terminal Value | 343,874 | |||||||||
| Present Terminal Value | 274,454 | |||||||||
| Enterprise Value | 292,108 | |||||||||
| Net Debt | -1,852 | |||||||||
| Equity Value | 293,960 | |||||||||
| Diluted Shares Outstanding, MM | 2,777 | |||||||||
| Equity Value Per Share | 105.86 |
What You Will Receive
- Comprehensive Yintai Gold Financials: Access detailed historical and projected data for precise valuation.
- Customizable Parameters: Adjust key metrics such as WACC, tax rates, revenue growth, and capital expenses.
- Dynamic Calculations: Intrinsic value and NPV are automatically calculated based on your inputs.
- Scenario Simulation: Evaluate various scenarios to forecast Yintai Gold’s future performance.
- User-Friendly Interface: Designed for industry professionals while remaining easy to navigate for newcomers.
Key Features
- 🔍 Real-Life Yintai Gold Financials: Pre-filled historical and projected data for Yintai Gold Co., Ltd. (000975SZ).
- ✏️ Fully Customizable Inputs: Modify all essential parameters (yellow cells) such as WACC, growth %, and tax rates.
- 📊 Professional DCF Valuation: Integrated formulas determine Yintai Gold’s intrinsic value utilizing the Discounted Cash Flow method.
- ⚡ Instant Results: Quickly visualize Yintai Gold’s valuation immediately after adjustments.
- Scenario Analysis: Evaluate and compare results for different financial assumptions side-by-side.
How It Works
- Step 1: Download the Excel file.
- Step 2: Review Yintai Gold Co., Ltd.'s pre-filled financial data and forecasts.
- Step 3: Adjust key inputs such as gold price projections, cost of production, and tax rates (highlighted cells).
- Step 4: Observe the DCF model update in real-time as you modify your assumptions.
- Step 5: Evaluate the results and utilize the data for your investment decisions.
Why Select the Yintai Gold Co., Ltd. Calculator?
- Save Time: Skip the hassle of building a DCF model from the ground up – it's ready for immediate use.
- Enhance Accuracy: Dependable financial data and formulas minimize valuation errors.
- Completely Customizable: Adapt the model to suit your own assumptions and forecasts.
- User-Friendly Interpretation: Intuitive charts and outputs facilitate straightforward analysis of results.
- Endorsed by Professionals: Crafted for experts who prioritize accuracy and functionality.
Who Should Consider Yintai Gold Co., Ltd. (000975SZ)?
- Investors: Evaluate the market position of Yintai Gold (000975SZ) before making stock trades.
- CFOs and Financial Analysts: Optimize valuation techniques and assess financial forecasts for Yintai Gold (000975SZ).
- Startup Founders: Discover the valuation methodologies applied to established companies like Yintai Gold (000975SZ).
- Consultants: Create detailed valuation reports tailored for clients leveraging insights from Yintai Gold (000975SZ).
- Students and Educators: Utilize current market data from Yintai Gold (000975SZ) for hands-on learning in valuation practices.
What the Template Contains
- Historical Data: Contains Yintai Gold Co., Ltd.'s (000975SZ) previous financial performance and foundational forecasts.
- DCF and Levered DCF Models: Comprehensive templates designed to assess the intrinsic value of Yintai Gold Co., Ltd. (000975SZ).
- WACC Sheet: Pre-calculated metrics for the Weighted Average Cost of Capital.
- Editable Inputs: Adjust key factors such as growth rates, EBITDA percentages, and CAPEX assumptions.
- Quarterly and Annual Statements: An extensive overview of Yintai Gold Co., Ltd.'s (000975SZ) financial statements.
- Interactive Dashboard: Explore valuation outcomes and forecasts in a dynamic visual format.
Disclaimer
All information, articles, and product details provided on this website are for general informational and educational purposes only. We do not claim any ownership over, nor do we intend to infringe upon, any trademarks, copyrights, logos, brand names, or other intellectual property mentioned or depicted on this site. Such intellectual property remains the property of its respective owners, and any references here are made solely for identification or informational purposes, without implying any affiliation, endorsement, or partnership.
We make no representations or warranties, express or implied, regarding the accuracy, completeness, or suitability of any content or products presented. Nothing on this website should be construed as legal, tax, investment, financial, medical, or other professional advice. In addition, no part of this site—including articles or product references—constitutes a solicitation, recommendation, endorsement, advertisement, or offer to buy or sell any securities, franchises, or other financial instruments, particularly in jurisdictions where such activity would be unlawful.
All content is of a general nature and may not address the specific circumstances of any individual or entity. It is not a substitute for professional advice or services. Any actions you take based on the information provided here are strictly at your own risk. You accept full responsibility for any decisions or outcomes arising from your use of this website and agree to release us from any liability in connection with your use of, or reliance upon, the content or products found herein.