
|
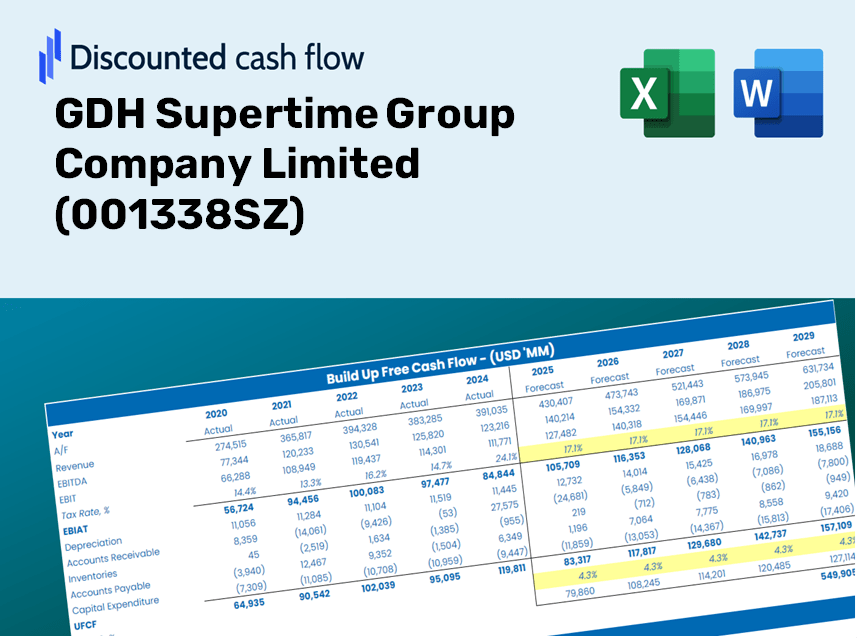
GDH Supertime Group Company Limited (001338.SZ) DCF Valuation |
Fully Editable: Tailor To Your Needs In Excel Or Sheets
Professional Design: Trusted, Industry-Standard Templates
Investor-Approved Valuation Models
MAC/PC Compatible, Fully Unlocked
No Expertise Is Needed; Easy To Follow
GDH Supertime Group Company Limited (001338.SZ) Bundle
Looking to assess the intrinsic value of GDH Supertime Group Company Limited? Our (001338SZ) DCF Calculator integrates real-world data with extensive customization features, enabling you to refine your forecasts and make more informed investment choices.
Benefits You'll Receive
- Customizable Excel Template: A fully adjustable Excel-based DCF Calculator featuring pre-filled real GDH Supertime Group Company Limited (001338SZ) financials.
- Authentic Data: Access to historical data and projected estimates (highlighted in the yellow cells).
- Adaptable Forecasting: Modify forecast parameters such as revenue growth, EBITDA %, and WACC.
- Instant Calculations: Observe the immediate effects of your inputs on the valuation of GDH Supertime Group Company Limited (001338SZ).
- Professional Resource: Tailored for investors, CFOs, consultants, and financial analysts.
- Intuitive Design: Organized for clarity and simplicity, complete with step-by-step guidance.
Key Features
- Authentic Financial Data for GDH Supertime: Gain access to reliable historical data and future forecasts tailored for (001338SZ).
- Adjustable Forecast Parameters: Modify highlighted fields such as WACC, growth rates, and profit margins as needed.
- Real-Time Calculations: Automatic updates for DCF, Net Present Value (NPV), and cash flow metrics.
- User-Friendly Dashboard: Intuitive charts and summaries to effectively visualize your valuation outcomes.
- Designed for All Skill Levels: An accessible layout suitable for investors, CFOs, and consultants alike.
How It Functions
- Download the Template: Gain immediate access to the Excel-based GDH Supertime Group DCF Calculator.
- Input Your Assumptions: Modify the yellow-highlighted cells for growth rates, WACC, margins, and other parameters.
- Instant Calculations: The model automatically recalculates GDH Supertime Group's intrinsic value.
- Test Scenarios: Explore various assumptions to assess potential changes in valuation.
- Analyze and Decide: Utilize the outcomes to inform your investment or financial assessments.
Why Opt for GDH Supertime Group's Calculator?
- All-in-One Solution: Combines DCF, WACC, and comprehensive financial ratio assessments in a single platform.
- Flexible Inputs: Modify the highlighted fields to explore different scenarios and outcomes.
- In-Depth Analysis: Automatically computes the intrinsic value and Net Present Value for GDH Supertime Group (001338SZ).
- Preloaded Information: Access to historical and projected data provides reliable starting points for analysis.
- Expert-Level Quality: Perfect for financial analysts, investors, and business consultants looking for precision.
Who Can Benefit from GDH Supertime Group Company Limited (001338SZ)?
- Investors: Accurately assess the fair value of GDH Supertime Group before making investment choices.
- CFOs: Utilize a sophisticated DCF model for comprehensive financial reporting and analysis.
- Consultants: Easily customize the template for valuation reports tailored to client needs.
- Entrepreneurs: Discover insights into the financial modeling techniques employed by leading firms.
- Educators: Employ it as a resource for teaching valuation methods effectively.
Contents of the Template
- Thorough DCF Model: An editable framework featuring detailed valuation calculations.
- Historical and Projected Data: Preloaded financial data for GDH Supertime Group Company Limited (001338SZ) for comprehensive analysis.
- Adjustable Assumptions: Modify WACC, growth rates, and tax parameters to explore different scenarios.
- Financial Statements: Complete annual and quarterly reports for in-depth insights.
- Essential Ratios: Integrated analysis for assessing profitability, efficiency, and leverage metrics.
- Visual Dashboard: Charts and tables designed for clear and actionable results.
Disclaimer
All information, articles, and product details provided on this website are for general informational and educational purposes only. We do not claim any ownership over, nor do we intend to infringe upon, any trademarks, copyrights, logos, brand names, or other intellectual property mentioned or depicted on this site. Such intellectual property remains the property of its respective owners, and any references here are made solely for identification or informational purposes, without implying any affiliation, endorsement, or partnership.
We make no representations or warranties, express or implied, regarding the accuracy, completeness, or suitability of any content or products presented. Nothing on this website should be construed as legal, tax, investment, financial, medical, or other professional advice. In addition, no part of this site—including articles or product references—constitutes a solicitation, recommendation, endorsement, advertisement, or offer to buy or sell any securities, franchises, or other financial instruments, particularly in jurisdictions where such activity would be unlawful.
All content is of a general nature and may not address the specific circumstances of any individual or entity. It is not a substitute for professional advice or services. Any actions you take based on the information provided here are strictly at your own risk. You accept full responsibility for any decisions or outcomes arising from your use of this website and agree to release us from any liability in connection with your use of, or reliance upon, the content or products found herein.