
|
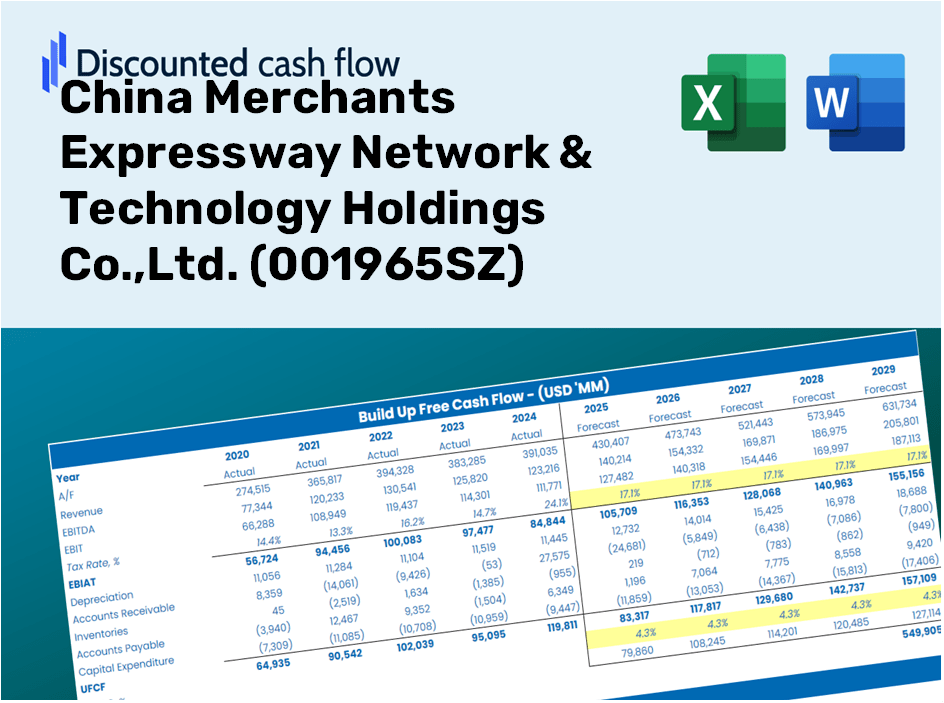
China Merchants Expressway Network & Technology Holdings Co.,Ltd. (001965.SZ) DCF Valuation |
Fully Editable: Tailor To Your Needs In Excel Or Sheets
Professional Design: Trusted, Industry-Standard Templates
Investor-Approved Valuation Models
MAC/PC Compatible, Fully Unlocked
No Expertise Is Needed; Easy To Follow
China Merchants Expressway Network & Technology Holdings Co.,Ltd. (001965.SZ) Bundle
If you're an investor or analyst, the DCF Calculator for China Merchants Expressway Network & Technology Holdings Co., Ltd. (001965SZ) is an essential tool for accurate valuation. It comes preloaded with real data from the company, allowing you to adjust forecasts and instantly observe the effects.
Discounted Cash Flow (DCF) - (USD MM)
| Year | AY1 2020 |
AY2 2021 |
AY3 2022 |
AY4 2023 |
AY5 2024 |
FY1 2025 |
FY2 2026 |
FY3 2027 |
FY4 2028 |
FY5 2029 |
|---|---|---|---|---|---|---|---|---|---|---|
| Revenue | 7,068.9 | 8,626.0 | 8,297.1 | 9,731.4 | 12,711.0 | 14,812.1 | 17,260.6 | 20,113.7 | 23,438.5 | 27,312.8 |
| Revenue Growth, % | 0 | 22.03 | -3.81 | 17.29 | 30.62 | 16.53 | 16.53 | 16.53 | 16.53 | 16.53 |
| EBITDA | 3,503.0 | 4,579.9 | 3,831.0 | 4,929.7 | 7,064.0 | 7,555.8 | 8,804.7 | 10,260.1 | 11,956.1 | 13,932.4 |
| EBITDA, % | 49.55 | 53.09 | 46.17 | 50.66 | 55.57 | 51.01 | 51.01 | 51.01 | 51.01 | 51.01 |
| Depreciation | 1,718.0 | 1,828.4 | 1,753.8 | 2,283.5 | 3,948.5 | 3,589.5 | 4,182.8 | 4,874.2 | 5,679.9 | 6,618.8 |
| Depreciation, % | 24.3 | 21.2 | 21.14 | 23.47 | 31.06 | 24.23 | 24.23 | 24.23 | 24.23 | 24.23 |
| EBIT | 1,785.0 | 2,751.5 | 2,077.2 | 2,646.2 | 3,115.4 | 3,966.3 | 4,621.9 | 5,385.9 | 6,276.2 | 7,313.6 |
| EBIT, % | 25.25 | 31.9 | 25.04 | 27.19 | 24.51 | 26.78 | 26.78 | 26.78 | 26.78 | 26.78 |
| Total Cash | 6,797.7 | 6,391.8 | 4,375.2 | 8,931.2 | 9,249.7 | 11,480.6 | 13,378.3 | 15,589.8 | 18,166.7 | 21,169.7 |
| Total Cash, percent | .0 | .0 | .0 | .0 | .0 | .0 | .0 | .0 | .0 | .0 |
| Account Receivables | 3,065.8 | 3,429.7 | 3,675.1 | 4,161.1 | 4,255.7 | 6,033.4 | 7,030.7 | 8,192.9 | 9,547.1 | 11,125.3 |
| Account Receivables, % | 43.37 | 39.76 | 44.29 | 42.76 | 33.48 | 40.73 | 40.73 | 40.73 | 40.73 | 40.73 |
| Inventories | 279.1 | 216.8 | 310.8 | 367.5 | 338.7 | 493.2 | 574.8 | 669.8 | 780.5 | 909.5 |
| Inventories, % | 3.95 | 2.51 | 3.75 | 3.78 | 2.66 | 3.33 | 3.33 | 3.33 | 3.33 | 3.33 |
| Accounts Payable | 1,873.4 | 1,992.3 | 2,065.8 | 2,239.6 | 2,519.7 | 3,475.9 | 4,050.5 | 4,720.0 | 5,500.3 | 6,409.5 |
| Accounts Payable, % | 26.5 | 23.1 | 24.9 | 23.01 | 19.82 | 23.47 | 23.47 | 23.47 | 23.47 | 23.47 |
| Capital Expenditure | -1,488.0 | -767.6 | -748.2 | -538.9 | -1,248.9 | -1,609.4 | -1,875.5 | -2,185.5 | -2,546.7 | -2,967.7 |
| Capital Expenditure, % | -21.05 | -8.9 | -9.02 | -5.54 | -9.83 | -10.87 | -10.87 | -10.87 | -10.87 | -10.87 |
| Tax Rate, % | 17.08 | 17.08 | 17.08 | 17.08 | 17.08 | 17.08 | 17.08 | 17.08 | 17.08 | 17.08 |
| EBITAT | 1,283.9 | 2,304.1 | 1,799.1 | 2,354.6 | 2,583.4 | 3,285.5 | 3,828.6 | 4,461.5 | 5,199.0 | 6,058.4 |
| Depreciation | ||||||||||
| Changes in Account Receivables | ||||||||||
| Changes in Inventories | ||||||||||
| Changes in Accounts Payable | ||||||||||
| Capital Expenditure | ||||||||||
| UFCF | 42.5 | 3,182.0 | 2,539.0 | 3,730.4 | 5,497.4 | 4,289.6 | 5,631.7 | 6,562.6 | 7,647.4 | 8,911.5 |
| WACC, % | 3.75 | 3.95 | 4 | 4.04 | 3.94 | 3.94 | 3.94 | 3.94 | 3.94 | 3.94 |
| PV UFCF | ||||||||||
| SUM PV UFCF | 29,085.0 | |||||||||
| Long Term Growth Rate, % | 3.00 | |||||||||
| Free cash flow (T + 1) | 9,179 | |||||||||
| Terminal Value | 979,833 | |||||||||
| Present Terminal Value | 807,803 | |||||||||
| Enterprise Value | 836,888 | |||||||||
| Net Debt | 48,748 | |||||||||
| Equity Value | 788,140 | |||||||||
| Diluted Shares Outstanding, MM | 7,003 | |||||||||
| Equity Value Per Share | 112.54 |
What You Will Receive
- Pre-Filled Financial Model: Utilize actual data from China Merchants Expressway Network & Technology Holdings Co., Ltd. (001965SZ) for accurate DCF valuations.
- Comprehensive Forecast Control: Modify key metrics such as revenue growth, profit margins, WACC, and other critical factors.
- Real-Time Calculations: Automatically updated figures allow you to view results instantly as you adjust parameters.
- Investor-Ready Template: A polished Excel file crafted for top-tier valuation presentations.
- Customizable and Reusable: Designed for adaptability, allowing you to perform in-depth forecasts repeatedly.
Key Features
- 🔍 Real-Life (001965SZ) Financials: Access pre-filled historical and projected data for China Merchants Expressway Network & Technology Holdings Co., Ltd.
- ✏️ Fully Customizable Inputs: Modify all essential parameters (yellow cells) such as WACC, growth %, and tax rates.
- 📊 Professional DCF Valuation: Utilize built-in formulas to determine the intrinsic value of (001965SZ) using the Discounted Cash Flow method.
- ⚡ Instant Results: Visualize the valuation of (001965SZ) immediately after making adjustments.
- Scenario Analysis: Compare and analyze outcomes based on various financial assumptions side-by-side.
How It Works
- 1. Download the Template: Retrieve and open the Excel file containing China Merchants Expressway Network & Technology Holdings Co., Ltd.'s preloaded data.
- 2. Adjust Assumptions: Modify critical inputs such as growth rates, WACC, and capital expenditures to suit your analysis.
- 3. View Results in Real-Time: The DCF model automatically computes the intrinsic value and NPV based on your inputs.
- 4. Explore Different Scenarios: Assess various forecasts to examine alternative valuation outcomes.
- 5. Present with Confidence: Share professional valuation insights to inform and enhance your decision-making processes.
Why Use This Calculator for China Merchants Expressway Network & Technology Holdings Co., Ltd. (001965SZ)?
- Precision: Utilizes authentic financial data for unrivaled accuracy.
- Customizability: Engineered to allow users to easily adjust and experiment with inputs.
- Efficiency: Eliminate the need to construct a DCF model from the ground up.
- High-Quality: Crafted with the expertise expected at the CFO level for superior functionality.
- Intuitive: Simple interface designed for users without extensive financial modeling skills.
Who Should Utilize This Product?
- Institutional Investors: Develop comprehensive and trustworthy valuation models for analyzing portfolios, particularly for (001965SZ).
- Corporate Finance Departments: Evaluate valuation scenarios to inform strategic decisions within their organizations.
- Financial Consultants and Advisors: Deliver precise valuation analyses to clients interested in (001965SZ).
- Students and Educators: Access real-world financial data to enhance learning and practice in financial modeling.
- Industry Enthusiasts: Gain insights into how companies like China Merchants Expressway Network & Technology Holdings Co., Ltd. are valued in the market.
Contents of the Template
- Operating and Balance Sheet Data: Pre-filled historical data and projections for China Merchants Expressway Network & Technology Holdings Co., Ltd. (001965SZ), including revenue, EBITDA, EBIT, and capital expenditures.
- WACC Calculation: A dedicated worksheet for the Weighted Average Cost of Capital (WACC), featuring parameters such as Beta, risk-free rate, and share price.
- DCF Valuation (Unlevered and Levered): Customizable Discounted Cash Flow models detailing intrinsic value with comprehensive calculations.
- Financial Statements: Pre-loaded annual and quarterly financial statements to facilitate thorough analysis.
- Key Ratios: Presents profitability, leverage, and efficiency ratios for China Merchants Expressway Network & Technology Holdings Co., Ltd. (001965SZ).
- Dashboard and Charts: Visual representation of valuation outputs and underlying assumptions, making result analysis straightforward.
Disclaimer
All information, articles, and product details provided on this website are for general informational and educational purposes only. We do not claim any ownership over, nor do we intend to infringe upon, any trademarks, copyrights, logos, brand names, or other intellectual property mentioned or depicted on this site. Such intellectual property remains the property of its respective owners, and any references here are made solely for identification or informational purposes, without implying any affiliation, endorsement, or partnership.
We make no representations or warranties, express or implied, regarding the accuracy, completeness, or suitability of any content or products presented. Nothing on this website should be construed as legal, tax, investment, financial, medical, or other professional advice. In addition, no part of this site—including articles or product references—constitutes a solicitation, recommendation, endorsement, advertisement, or offer to buy or sell any securities, franchises, or other financial instruments, particularly in jurisdictions where such activity would be unlawful.
All content is of a general nature and may not address the specific circumstances of any individual or entity. It is not a substitute for professional advice or services. Any actions you take based on the information provided here are strictly at your own risk. You accept full responsibility for any decisions or outcomes arising from your use of this website and agree to release us from any liability in connection with your use of, or reliance upon, the content or products found herein.