
|
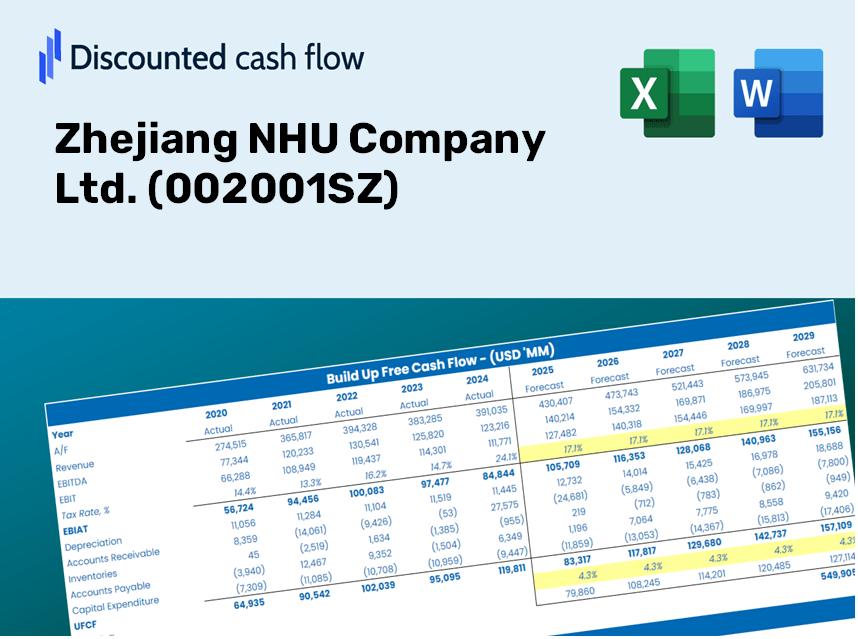
Zhejiang NHU Company Ltd. (002001.SZ) DCF Valuation |
Fully Editable: Tailor To Your Needs In Excel Or Sheets
Professional Design: Trusted, Industry-Standard Templates
Investor-Approved Valuation Models
MAC/PC Compatible, Fully Unlocked
No Expertise Is Needed; Easy To Follow
Zhejiang NHU Company Ltd. (002001.SZ) Bundle
Maximize efficiency and improve precision with our (002001SZ) DCF Calculator! Utilizing real data from Zhejiang NHU Company Ltd. and customizable assumptions, this tool empowers you to forecast, analyze, and value (002001SZ) like a seasoned investor.
Discounted Cash Flow (DCF) - (USD MM)
| Year | AY1 2020 |
AY2 2021 |
AY3 2022 |
AY4 2023 |
AY5 2024 |
FY1 2025 |
FY2 2026 |
FY3 2027 |
FY4 2028 |
FY5 2029 |
|---|---|---|---|---|---|---|---|---|---|---|
| Revenue | 10,314.1 | 14,798.0 | 15,934.0 | 15,116.5 | 21,609.6 | 26,416.3 | 32,292.2 | 39,475.0 | 48,255.6 | 58,989.2 |
| Revenue Growth, % | 0 | 43.47 | 7.68 | -5.13 | 42.95 | 22.24 | 22.24 | 22.24 | 22.24 | 22.24 |
| EBITDA | 5,182.3 | 6,579.8 | 5,878.0 | 5,247.9 | 9,413.8 | 11,088.4 | 13,554.8 | 16,569.9 | 20,255.5 | 24,761.1 |
| EBITDA, % | 50.25 | 44.46 | 36.89 | 34.72 | 43.56 | 41.98 | 41.98 | 41.98 | 41.98 | 41.98 |
| Depreciation | 865.6 | 1,228.3 | 1,396.8 | 1,711.7 | 2,223.0 | 2,486.8 | 3,040.0 | 3,716.2 | 4,542.8 | 5,553.3 |
| Depreciation, % | 8.39 | 8.3 | 8.77 | 11.32 | 10.29 | 9.41 | 9.41 | 9.41 | 9.41 | 9.41 |
| EBIT | 4,316.7 | 5,351.4 | 4,481.2 | 3,536.1 | 7,190.8 | 8,601.5 | 10,514.8 | 12,853.6 | 15,712.7 | 19,207.8 |
| EBIT, % | 41.85 | 36.16 | 28.12 | 23.39 | 33.28 | 32.56 | 32.56 | 32.56 | 32.56 | 32.56 |
| Total Cash | 5,779.9 | 7,203.6 | 6,064.2 | 4,716.4 | 7,937.3 | 11,132.2 | 13,608.4 | 16,635.4 | 20,335.6 | 24,858.9 |
| Total Cash, percent | .0 | .0 | .0 | .0 | .0 | .0 | .0 | .0 | .0 | .0 |
| Account Receivables | 2,558.4 | 3,287.2 | .0 | 2,931.0 | 4,695.7 | 4,656.5 | 5,692.3 | 6,958.5 | 8,506.3 | 10,398.4 |
| Account Receivables, % | 24.8 | 22.21 | 0 | 19.39 | 21.73 | 17.63 | 17.63 | 17.63 | 17.63 | 17.63 |
| Inventories | 3,117.0 | 3,193.7 | 4,144.6 | 4,318.9 | 4,090.1 | 6,620.5 | 8,093.2 | 9,893.3 | 12,094.0 | 14,784.1 |
| Inventories, % | 30.22 | 21.58 | 26.01 | 28.57 | 18.93 | 25.06 | 25.06 | 25.06 | 25.06 | 25.06 |
| Accounts Payable | 1,961.4 | 2,130.1 | 2,175.5 | 2,280.3 | 1,845.1 | 3,734.6 | 4,565.3 | 5,580.8 | 6,822.1 | 8,339.6 |
| Accounts Payable, % | 19.02 | 14.39 | 13.65 | 15.08 | 8.54 | 14.14 | 14.14 | 14.14 | 14.14 | 14.14 |
| Capital Expenditure | -2,352.9 | -3,472.7 | -4,931.9 | -4,445.5 | -1,599.8 | -6,025.2 | -7,365.4 | -9,003.8 | -11,006.5 | -13,454.7 |
| Capital Expenditure, % | -22.81 | -23.47 | -30.95 | -29.41 | -7.4 | -22.81 | -22.81 | -22.81 | -22.81 | -22.81 |
| Tax Rate, % | 15.48 | 15.48 | 15.48 | 15.48 | 15.48 | 15.48 | 15.48 | 15.48 | 15.48 | 15.48 |
| EBITAT | 3,743.1 | 4,633.6 | 3,827.9 | 2,939.1 | 6,077.5 | 7,334.6 | 8,966.1 | 10,960.4 | 13,398.4 | 16,378.6 |
| Depreciation | ||||||||||
| Changes in Account Receivables | ||||||||||
| Changes in Inventories | ||||||||||
| Changes in Accounts Payable | ||||||||||
| Capital Expenditure | ||||||||||
| UFCF | -1,458.3 | 1,752.5 | 2,674.5 | -2,795.1 | 4,729.7 | 3,194.3 | 2,962.9 | 3,622.0 | 4,427.6 | 5,412.5 |
| WACC, % | 6.86 | 6.86 | 6.85 | 6.84 | 6.85 | 6.85 | 6.85 | 6.85 | 6.85 | 6.85 |
| PV UFCF | ||||||||||
| SUM PV UFCF | 15,835.8 | |||||||||
| Long Term Growth Rate, % | 2.00 | |||||||||
| Free cash flow (T + 1) | 5,521 | |||||||||
| Terminal Value | 113,780 | |||||||||
| Present Terminal Value | 81,687 | |||||||||
| Enterprise Value | 97,523 | |||||||||
| Net Debt | -1,443 | |||||||||
| Equity Value | 98,966 | |||||||||
| Diluted Shares Outstanding, MM | 3,073 | |||||||||
| Equity Value Per Share | 32.21 |
Benefits You'll Receive
- Pre-Loaded Financial Model: Utilize Zhejiang NHU’s actual financial data for accurate DCF valuation.
- Complete Forecast Flexibility: Modify revenue growth, profit margins, WACC, and other critical factors.
- Real-Time Calculations: Instant updates provide immediate insights as you adjust inputs.
- Professional-Grade Template: A polished Excel spreadsheet created for top-tier valuation.
- Customizable and Reusable: Designed for adaptability, allowing for ongoing use in detailed forecasts.
Key Features
- Real-Life NHU Data: Pre-loaded with Zhejiang NHU Company Ltd.'s historical financials and future projections.
- Fully Customizable Inputs: Tailor factors such as revenue growth, profit margins, WACC, tax rates, and capital expenditures to your needs.
- Dynamic Valuation Model: Automatically refreshes Net Present Value (NPV) and intrinsic value in response to your adjustments.
- Scenario Testing: Generate multiple forecasting scenarios to evaluate various valuation results.
- User-Friendly Design: Intuitive layout designed for both industry professionals and novices.
How It Operates
- Download the Template: Gain immediate access to the Excel-based ZHEJ NHU DCF Calculator.
- Input Your Assumptions: Modify the yellow-highlighted cells for growth rates, WACC, margins, and other parameters.
- Instant Calculations: The model will automatically refresh to display Zhejiang NHU's intrinsic value.
- Test Scenarios: Experiment with various assumptions to assess possible valuation shifts.
- Analyze and Decide: Utilize the outcomes to inform your investment or financial analysis.
Why Select This Calculator?
- Reliable Data: Utilize authentic Zhejiang NHU Company Ltd. (002001SZ) financials for trustworthy valuation outcomes.
- Flexible Options: Modify essential parameters such as growth rates, WACC, and tax rates to align with your forecasts.
- Efficiency Boost: Ready-made calculations save you the effort of building from the ground up.
- Professional Quality: Tailored for investors, analysts, and consultants in the field.
- Easy to Use: User-friendly design and guided instructions ensure accessibility for everyone.
Who Can Benefit from This Product?
- Investors: Evaluate Zhejiang NHU Company Ltd.'s (002001SZ) valuation before making stock transactions.
- CFOs and Financial Analysts: Enhance valuation methodologies and validate financial projections.
- Startup Founders: Gain insights into how leading public firms like Zhejiang NHU are appraised.
- Consultants: Create comprehensive valuation reports for your clients.
- Students and Educators: Utilize actual market data to practice and instruct on valuation techniques.
Contents of the Template
- Pre-Filled Data: Features Zhejiang NHU Company Ltd.'s historical financials and projections.
- Discounted Cash Flow Model: An editable DCF valuation model with automatic calculations.
- Weighted Average Cost of Capital (WACC): A specific sheet for calculating WACC based on user-defined inputs.
- Key Financial Ratios: Assess Zhejiang NHU Company Ltd.'s profitability, efficiency, and financial leverage.
- Customizable Inputs: Easily modify revenue growth, profit margins, and tax rates.
- Clear Dashboard: Visuals and tables that summarize important valuation outcomes.
Disclaimer
All information, articles, and product details provided on this website are for general informational and educational purposes only. We do not claim any ownership over, nor do we intend to infringe upon, any trademarks, copyrights, logos, brand names, or other intellectual property mentioned or depicted on this site. Such intellectual property remains the property of its respective owners, and any references here are made solely for identification or informational purposes, without implying any affiliation, endorsement, or partnership.
We make no representations or warranties, express or implied, regarding the accuracy, completeness, or suitability of any content or products presented. Nothing on this website should be construed as legal, tax, investment, financial, medical, or other professional advice. In addition, no part of this site—including articles or product references—constitutes a solicitation, recommendation, endorsement, advertisement, or offer to buy or sell any securities, franchises, or other financial instruments, particularly in jurisdictions where such activity would be unlawful.
All content is of a general nature and may not address the specific circumstances of any individual or entity. It is not a substitute for professional advice or services. Any actions you take based on the information provided here are strictly at your own risk. You accept full responsibility for any decisions or outcomes arising from your use of this website and agree to release us from any liability in connection with your use of, or reliance upon, the content or products found herein.