
|
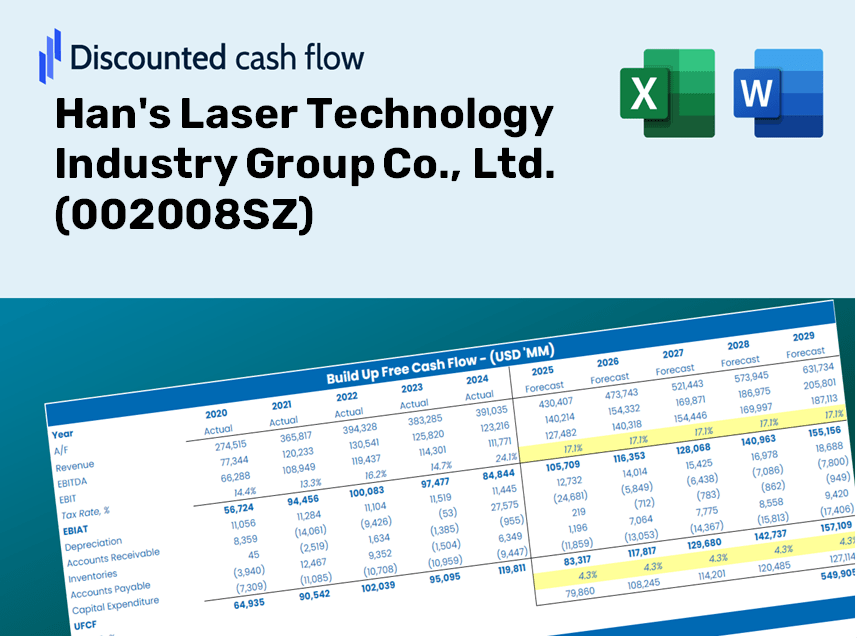
Han's Laser Technology Industry Group Co., Ltd. (002008.SZ) DCF Valuation |
Fully Editable: Tailor To Your Needs In Excel Or Sheets
Professional Design: Trusted, Industry-Standard Templates
Investor-Approved Valuation Models
MAC/PC Compatible, Fully Unlocked
No Expertise Is Needed; Easy To Follow
Han's Laser Technology Industry Group Co., Ltd. (002008.SZ) Bundle
Discover the true potential of Han's Laser Technology Industry Group Co., Ltd. (002008SZ) with our advanced DCF Calculator! Adjust key assumptions, explore various scenarios, and evaluate how changes affect the valuation of Han's Laser – all within one easy-to-use Excel template.
Discounted Cash Flow (DCF) - (USD MM)
| Year | AY1 2020 |
AY2 2021 |
AY3 2022 |
AY4 2023 |
AY5 2024 |
FY1 2025 |
FY2 2026 |
FY3 2027 |
FY4 2028 |
FY5 2029 |
|---|---|---|---|---|---|---|---|---|---|---|
| Revenue | 11,942.5 | 16,332.3 | 14,961.2 | 14,091.1 | 14,771.2 | 15,782.1 | 16,862.1 | 18,016.1 | 19,249.0 | 20,566.3 |
| Revenue Growth, % | 0 | 36.76 | -8.4 | -5.82 | 4.83 | 6.84 | 6.84 | 6.84 | 6.84 | 6.84 |
| EBITDA | 1,614.9 | 2,944.1 | 1,994.3 | 1,662.5 | 2,393.7 | 2,300.5 | 2,457.9 | 2,626.1 | 2,805.8 | 2,997.8 |
| EBITDA, % | 13.52 | 18.03 | 13.33 | 11.8 | 16.21 | 14.58 | 14.58 | 14.58 | 14.58 | 14.58 |
| Depreciation | 267.9 | 397.2 | 535.5 | 567.0 | 419.4 | 477.2 | 509.9 | 544.7 | 582.0 | 621.9 |
| Depreciation, % | 2.24 | 2.43 | 3.58 | 4.02 | 2.84 | 3.02 | 3.02 | 3.02 | 3.02 | 3.02 |
| EBIT | 1,347.0 | 2,546.9 | 1,458.8 | 1,095.4 | 1,974.3 | 1,823.3 | 1,948.0 | 2,081.4 | 2,223.8 | 2,376.0 |
| EBIT, % | 11.28 | 15.59 | 9.75 | 7.77 | 13.37 | 11.55 | 11.55 | 11.55 | 11.55 | 11.55 |
| Total Cash | 4,906.7 | 5,994.9 | 9,615.8 | 10,756.5 | 8,236.9 | 8,653.7 | 9,245.9 | 9,878.7 | 10,554.7 | 11,277.0 |
| Total Cash, percent | .0 | .0 | .0 | .0 | .0 | .0 | .0 | .0 | .0 | .0 |
| Account Receivables | 5,083.0 | 7,654.6 | 9,079.7 | 9,089.2 | 10,288.2 | 8,972.8 | 9,586.9 | 10,242.9 | 10,943.9 | 11,692.9 |
| Account Receivables, % | 42.56 | 46.87 | 60.69 | 64.5 | 69.65 | 56.85 | 56.85 | 56.85 | 56.85 | 56.85 |
| Inventories | 3,681.7 | 5,015.2 | 4,576.7 | 4,393.4 | 3,961.3 | 4,738.5 | 5,062.8 | 5,409.2 | 5,779.4 | 6,174.9 |
| Inventories, % | 30.83 | 30.71 | 30.59 | 31.18 | 26.82 | 30.02 | 30.02 | 30.02 | 30.02 | 30.02 |
| Accounts Payable | 4,791.3 | 6,587.4 | 6,347.4 | 6,790.4 | 7,835.3 | 7,073.9 | 7,558.0 | 8,075.3 | 8,627.9 | 9,218.3 |
| Accounts Payable, % | 40.12 | 40.33 | 42.43 | 48.19 | 53.04 | 44.82 | 44.82 | 44.82 | 44.82 | 44.82 |
| Capital Expenditure | -921.0 | -734.0 | -969.5 | -1,473.7 | -1,394.4 | -1,217.9 | -1,301.2 | -1,390.3 | -1,485.4 | -1,587.1 |
| Capital Expenditure, % | -7.71 | -4.49 | -6.48 | -10.46 | -9.44 | -7.72 | -7.72 | -7.72 | -7.72 | -7.72 |
| Tax Rate, % | 7.74 | 7.74 | 7.74 | 7.74 | 7.74 | 7.74 | 7.74 | 7.74 | 7.74 | 7.74 |
| EBITAT | 1,236.9 | 2,202.1 | 1,351.8 | 1,090.4 | 1,821.4 | 1,687.4 | 1,802.9 | 1,926.3 | 2,058.1 | 2,199.0 |
| Depreciation | ||||||||||
| Changes in Account Receivables | ||||||||||
| Changes in Inventories | ||||||||||
| Changes in Accounts Payable | ||||||||||
| Capital Expenditure | ||||||||||
| UFCF | -3,389.6 | -243.6 | -308.7 | 800.5 | 1,124.4 | 723.6 | 557.3 | 595.5 | 636.2 | 679.8 |
| WACC, % | 7.62 | 7.6 | 7.63 | 7.65 | 7.62 | 7.62 | 7.62 | 7.62 | 7.62 | 7.62 |
| PV UFCF | ||||||||||
| SUM PV UFCF | 2,576.1 | |||||||||
| Long Term Growth Rate, % | 3.00 | |||||||||
| Free cash flow (T + 1) | 700 | |||||||||
| Terminal Value | 15,139 | |||||||||
| Present Terminal Value | 10,484 | |||||||||
| Enterprise Value | 13,060 | |||||||||
| Net Debt | -3,206 | |||||||||
| Equity Value | 16,267 | |||||||||
| Diluted Shares Outstanding, MM | 1,046 | |||||||||
| Equity Value Per Share | 15.56 |
Benefits You Will Receive
- Adjustable Forecast Inputs: Seamlessly modify assumptions (growth %, profit margins, WACC) to explore various scenarios.
- Comprehensive Data: Han's Laser Technology's financial information pre-loaded to enhance your analysis.
- Automated DCF Outputs: The template computes Net Present Value (NPV) and intrinsic value for your convenience.
- Customizable and Professional Design: A refined Excel model tailored to your valuation requirements.
- Designed for Analysts and Investors: Perfect for evaluating projections, validating strategies, and increasing efficiency.
Key Features
- Customizable Forecast Inputs: Adjust essential metrics such as revenue growth, EBITDA margin, and capital investments.
- Instant DCF Valuation: Automatically computes intrinsic value, net present value (NPV), and additional outputs in real time.
- High-Precision Accuracy: Leverages Han's Laser's actual financial data for dependable valuation results.
- Simplified Scenario Analysis: Easily explore various assumptions and assess their impacts without hassle.
- Efficiency Booster: Streamline your process by removing the need to create intricate valuation models from the ground up.
How It Operates
- Step 1: Download the Excel file.
- Step 2: Examine the pre-filled financial data and forecasts for Han's Laser Technology Industry Group Co., Ltd. (002008SZ).
- Step 3: Adjust key parameters such as revenue growth, WACC, and tax rates (highlighted cells).
- Step 4: Observe real-time updates to the DCF model as you modify your assumptions.
- Step 5: Evaluate the outputs and leverage the findings for your investment strategies.
Why Choose This Calculator for Han's Laser Technology Industry Group Co., Ltd. (002008SZ)?
- User-Friendly Interface: Crafted for both novices and seasoned professionals.
- Customizable Inputs: Easily adjust parameters to suit your specific analysis needs.
- Real-Time Valuation: Observe immediate updates to Han's valuation as you change the inputs.
- Preconfigured Data: Comes with Han's actual financial metrics for swift analysis.
- Relied Upon by Experts: Favored by investors and analysts for informed decision-making.
Who Can Benefit from This Product?
- Investors: Assess Han's Laser Technology's valuation prior to making stock trades.
- CFOs and Financial Analysts: Optimize valuation workflows and evaluate financial projections.
- Startup Founders: Understand how leading public companies like Han's Laser are valued.
- Consultants: Create comprehensive valuation reports for your clients.
- Students and Educators: Utilize real market data to practice and teach valuation methodologies.
Contents of the Template
- Pre-Filled DCF Model: Han's Laser Technology's financial data preloaded for immediate application.
- WACC Calculator: Comprehensive calculations for the Weighted Average Cost of Capital.
- Financial Ratios: Analyze Han's profitability, leverage, and operational efficiency.
- Editable Inputs: Adjust assumptions such as growth rates, margins, and CAPEX to suit your specific scenarios.
- Financial Statements: Access annual and quarterly reports for in-depth analysis.
- Interactive Dashboard: Visualize essential valuation metrics and outcomes with ease.
Disclaimer
All information, articles, and product details provided on this website are for general informational and educational purposes only. We do not claim any ownership over, nor do we intend to infringe upon, any trademarks, copyrights, logos, brand names, or other intellectual property mentioned or depicted on this site. Such intellectual property remains the property of its respective owners, and any references here are made solely for identification or informational purposes, without implying any affiliation, endorsement, or partnership.
We make no representations or warranties, express or implied, regarding the accuracy, completeness, or suitability of any content or products presented. Nothing on this website should be construed as legal, tax, investment, financial, medical, or other professional advice. In addition, no part of this site—including articles or product references—constitutes a solicitation, recommendation, endorsement, advertisement, or offer to buy or sell any securities, franchises, or other financial instruments, particularly in jurisdictions where such activity would be unlawful.
All content is of a general nature and may not address the specific circumstances of any individual or entity. It is not a substitute for professional advice or services. Any actions you take based on the information provided here are strictly at your own risk. You accept full responsibility for any decisions or outcomes arising from your use of this website and agree to release us from any liability in connection with your use of, or reliance upon, the content or products found herein.