
|
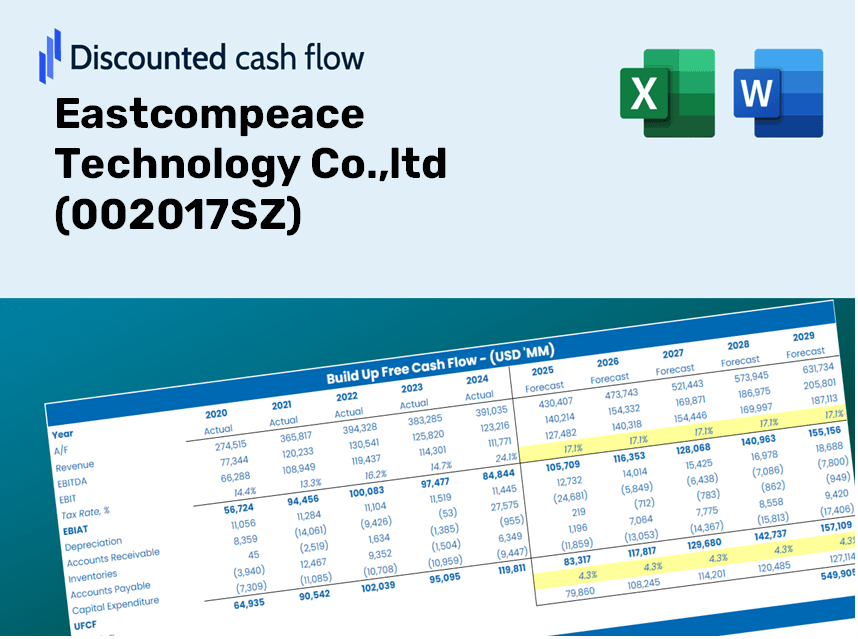
Eastcompeace Technology Co.,ltd (002017.SZ) DCF Valuation |
Fully Editable: Tailor To Your Needs In Excel Or Sheets
Professional Design: Trusted, Industry-Standard Templates
Investor-Approved Valuation Models
MAC/PC Compatible, Fully Unlocked
No Expertise Is Needed; Easy To Follow
Eastcompeace Technology Co.,ltd (002017.SZ) Bundle
Designed for accuracy, our (002017SZ) DCF Calculator enables you to evaluate Eastcompeace Technology Co., Ltd's valuation using real-world financial data and offers complete flexibility to modify all key parameters for enhanced projections.
Discounted Cash Flow (DCF) - (USD MM)
| Year | AY1 2020 |
AY2 2021 |
AY3 2022 |
AY4 2023 |
AY5 2024 |
FY1 2025 |
FY2 2026 |
FY3 2027 |
FY4 2028 |
FY5 2029 |
|---|---|---|---|---|---|---|---|---|---|---|
| Revenue | 1,062.7 | 1,072.5 | 1,285.7 | 1,382.2 | 1,384.6 | 1,483.2 | 1,588.9 | 1,702.0 | 1,823.2 | 1,953.0 |
| Revenue Growth, % | 0 | 0.92229 | 19.88 | 7.5 | 0.17792 | 7.12 | 7.12 | 7.12 | 7.12 | 7.12 |
| EBITDA | 62.2 | 43.3 | 125.1 | 183.4 | 201.0 | 140.6 | 150.7 | 161.4 | 172.9 | 185.2 |
| EBITDA, % | 5.85 | 4.04 | 9.73 | 13.27 | 14.52 | 9.48 | 9.48 | 9.48 | 9.48 | 9.48 |
| Depreciation | 42.5 | 36.1 | 34.8 | 31.3 | 29.4 | 42.9 | 45.9 | 49.2 | 52.7 | 56.5 |
| Depreciation, % | 4 | 3.36 | 2.71 | 2.27 | 2.12 | 2.89 | 2.89 | 2.89 | 2.89 | 2.89 |
| EBIT | 19.7 | 7.3 | 90.3 | 152.1 | 171.6 | 97.8 | 104.7 | 112.2 | 120.2 | 128.7 |
| EBIT, % | 1.86 | 0.67829 | 7.02 | 11 | 12.4 | 6.59 | 6.59 | 6.59 | 6.59 | 6.59 |
| Total Cash | 1,248.1 | 1,459.8 | 1,705.8 | 1,811.0 | 1,885.7 | 1,483.2 | 1,588.9 | 1,702.0 | 1,823.2 | 1,953.0 |
| Total Cash, percent | .0 | .0 | .0 | .0 | .0 | .0 | .0 | .0 | .0 | .0 |
| Account Receivables | 123.7 | 169.8 | 216.5 | 158.8 | 205.7 | 209.6 | 224.5 | 240.5 | 257.7 | 276.0 |
| Account Receivables, % | 11.64 | 15.83 | 16.84 | 11.49 | 14.86 | 14.13 | 14.13 | 14.13 | 14.13 | 14.13 |
| Inventories | 356.4 | 305.6 | 563.3 | 642.6 | 592.4 | 578.8 | 620.0 | 664.2 | 711.5 | 762.2 |
| Inventories, % | 33.54 | 28.5 | 43.81 | 46.49 | 42.79 | 39.02 | 39.02 | 39.02 | 39.02 | 39.02 |
| Accounts Payable | 269.1 | 333.6 | 580.8 | 464.1 | 37.0 | 408.9 | 438.0 | 469.2 | 502.7 | 538.5 |
| Accounts Payable, % | 25.32 | 31.1 | 45.17 | 33.58 | 2.67 | 27.57 | 27.57 | 27.57 | 27.57 | 27.57 |
| Capital Expenditure | -25.0 | -31.4 | -24.6 | -31.2 | -24.5 | -33.3 | -35.6 | -38.2 | -40.9 | -43.8 |
| Capital Expenditure, % | -2.35 | -2.93 | -1.91 | -2.26 | -1.77 | -2.24 | -2.24 | -2.24 | -2.24 | -2.24 |
| Tax Rate, % | 9.35 | 9.35 | 9.35 | 9.35 | 9.35 | 9.35 | 9.35 | 9.35 | 9.35 | 9.35 |
| EBITAT | 17.1 | 6.0 | 67.7 | 125.1 | 155.6 | 81.5 | 87.3 | 93.5 | 100.1 | 107.3 |
| Depreciation | ||||||||||
| Changes in Account Receivables | ||||||||||
| Changes in Inventories | ||||||||||
| Changes in Accounts Payable | ||||||||||
| Capital Expenditure | ||||||||||
| UFCF | -176.4 | 79.8 | 20.8 | -13.1 | -263.4 | 472.7 | 70.5 | 75.5 | 80.9 | 86.7 |
| WACC, % | 8.64 | 8.64 | 8.64 | 8.64 | 8.64 | 8.64 | 8.64 | 8.64 | 8.64 | 8.64 |
| PV UFCF | ||||||||||
| SUM PV UFCF | 669.2 | |||||||||
| Long Term Growth Rate, % | 2.00 | |||||||||
| Free cash flow (T + 1) | 88 | |||||||||
| Terminal Value | 1,332 | |||||||||
| Present Terminal Value | 880 | |||||||||
| Enterprise Value | 1,550 | |||||||||
| Net Debt | -1,881 | |||||||||
| Equity Value | 3,431 | |||||||||
| Diluted Shares Outstanding, MM | 580 | |||||||||
| Equity Value Per Share | 5.91 |
Benefits You Will Receive
- Customizable Excel Template: A versatile Excel-based DCF Calculator featuring pre-loaded financial data for Eastcompeace Technology Co., Ltd (002017SZ).
- Current Market Data: Access to historical figures and future projections (highlighted in the yellow cells).
- Adjustable Forecasting: Flexibility to modify assumptions like revenue growth, EBITDA percentage, and WACC.
- Instant Calculations: Quickly observe how your inputs influence the valuation of Eastcompeace Technology Co., Ltd (002017SZ).
- Professional Resource: Designed for investors, CFOs, consultants, and financial analysts.
- User-Friendly Interface: Organized for straightforward navigation, complete with step-by-step guidance.
Key Features
- Comprehensive Financial Data for Eastcompeace Technology: Comes with historical financial metrics and projections for the future.
- Fully Customizable Variables: Tailor parameters such as revenue growth, profit margins, discount rates, tax rates, and capital expenditures.
- Dynamic Valuation Model: Automatic recalculations of Net Present Value (NPV) and intrinsic value based on your specified inputs.
- Scenario Analysis: Develop various forecasting scenarios to explore a range of valuation possibilities.
- User-Friendly Layout: Intuitive and organized design suitable for both professionals and novices.
How It Works
- Step 1: Download the Excel file for Eastcompeace Technology Co., Ltd (002017SZ).
- Step 2: Review the pre-filled financial data and forecasts for Eastcompeace Technology.
- Step 3: Adjust key inputs such as revenue growth, WACC, and tax rates (highlighted cells).
- Step 4: Observe the DCF model update in real time as you modify your assumptions.
- Step 5: Evaluate the outputs and utilize the results to inform your investment choices.
Why Opt for This Calculator?
- Designed for Experts: A sophisticated tool utilized by analysts, CFOs, and consultants in the field.
- Accurate Data: Eastcompeace Technology's historical and projected financials preloaded for precision.
- Scenario Analysis: Effortlessly simulate various forecasts and assumptions.
- Clear Results: Instantly calculates intrinsic value, NPV, and essential metrics.
- User-Friendly: Comprehensive step-by-step guidance throughout the process.
Who Can Benefit from Eastcompeace Technology Co., Ltd (002017SZ)?
- Investors: Make informed decisions with a robust valuation tool tailored for the tech industry.
- Financial Analysts: Streamline your workflow with a customizable pre-built DCF model specific to Eastcompeace Technology.
- Consultants: Effortlessly modify the template for client presentations or insightful reports on Eastcompeace Technology.
- Finance Enthusiasts: Enhance your grasp of valuation methodologies with real-world applications from Eastcompeace Technology's performance.
- Educators and Students: Employ this resource as a hands-on tool in finance courses focused on technology companies.
What the Template Includes
- Pre-Filled DCF Model: Eastcompeace Technology Co., Ltd’s financial data preloaded for immediate analysis.
- WACC Calculator: Comprehensive calculations for Weighted Average Cost of Capital.
- Financial Ratios: Assess Eastcompeace's profitability, leverage, and operational efficiency.
- Editable Inputs: Modify assumptions like growth rates, margins, and CAPEX to suit your scenarios.
- Financial Statements: Access annual and quarterly reports to facilitate in-depth analysis.
- Interactive Dashboard: Effortlessly visualize essential valuation metrics and outcomes.
Disclaimer
All information, articles, and product details provided on this website are for general informational and educational purposes only. We do not claim any ownership over, nor do we intend to infringe upon, any trademarks, copyrights, logos, brand names, or other intellectual property mentioned or depicted on this site. Such intellectual property remains the property of its respective owners, and any references here are made solely for identification or informational purposes, without implying any affiliation, endorsement, or partnership.
We make no representations or warranties, express or implied, regarding the accuracy, completeness, or suitability of any content or products presented. Nothing on this website should be construed as legal, tax, investment, financial, medical, or other professional advice. In addition, no part of this site—including articles or product references—constitutes a solicitation, recommendation, endorsement, advertisement, or offer to buy or sell any securities, franchises, or other financial instruments, particularly in jurisdictions where such activity would be unlawful.
All content is of a general nature and may not address the specific circumstances of any individual or entity. It is not a substitute for professional advice or services. Any actions you take based on the information provided here are strictly at your own risk. You accept full responsibility for any decisions or outcomes arising from your use of this website and agree to release us from any liability in connection with your use of, or reliance upon, the content or products found herein.