
|
GuiZhou QianYuan Power Co., Ltd. (002039.SZ) DCF Valuation |
Fully Editable: Tailor To Your Needs In Excel Or Sheets
Professional Design: Trusted, Industry-Standard Templates
Investor-Approved Valuation Models
MAC/PC Compatible, Fully Unlocked
No Expertise Is Needed; Easy To Follow
GuiZhou QianYuan Power Co., Ltd. (002039.SZ) Bundle
Simplify GuiZhou QianYuan Power Co., Ltd. (002039SZ) valuation with this customizable DCF Calculator! Featuring real GuiZhou QianYuan Power Co., Ltd. (002039SZ) financials and adjustable forecast inputs, you can test scenarios and uncover GuiZhou QianYuan Power Co., Ltd. (002039SZ) fair value in minutes.
Discounted Cash Flow (DCF) - (USD MM)
| Year | AY1 2020 |
AY2 2021 |
AY3 2022 |
AY4 2023 |
AY5 2024 |
FY1 2025 |
FY2 2026 |
FY3 2027 |
FY4 2028 |
FY5 2029 |
|---|---|---|---|---|---|---|---|---|---|---|
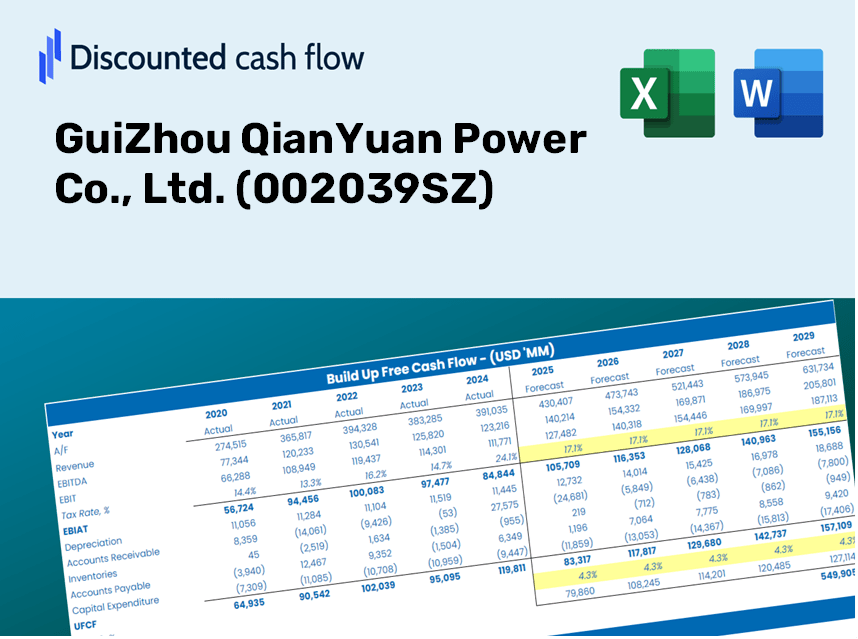
| Revenue | 2,650.6 | 2,071.6 | 2,613.1 | 1,990.4 | 1,932.8 | 1,989.2 | 2,047.2 | 2,106.9 | 2,168.4 | 2,231.6 |
| Revenue Growth, % | 0 | -21.84 | 26.14 | -23.83 | -2.89 | 2.92 | 2.92 | 2.92 | 2.92 | 2.92 |
| EBITDA | 2,082.4 | 1,654.5 | 2,028.9 | 1,421.5 | 1,351.1 | 1,501.4 | 1,545.2 | 1,590.3 | 1,636.7 | 1,684.4 |
| EBITDA, % | 78.56 | 79.87 | 77.64 | 71.42 | 69.9 | 75.48 | 75.48 | 75.48 | 75.48 | 75.48 |
| Depreciation | 801.9 | 646.7 | 707.5 | 547.7 | 548.1 | 574.6 | 591.3 | 608.6 | 626.3 | 644.6 |
| Depreciation, % | 30.25 | 31.22 | 27.07 | 27.52 | 28.36 | 28.88 | 28.88 | 28.88 | 28.88 | 28.88 |
| EBIT | 1,280.5 | 1,007.9 | 1,321.4 | 873.8 | 803.0 | 926.9 | 953.9 | 981.7 | 1,010.4 | 1,039.8 |
| EBIT, % | 48.31 | 48.65 | 50.57 | 43.9 | 41.54 | 46.6 | 46.6 | 46.6 | 46.6 | 46.6 |
| Total Cash | 163.5 | 237.9 | 225.6 | 253.3 | 172.6 | 190.7 | 196.3 | 202.0 | 207.9 | 214.0 |
| Total Cash, percent | .0 | .0 | .0 | .0 | .0 | .0 | .0 | .0 | .0 | .0 |
| Account Receivables | 309.3 | 468.3 | 568.2 | 164.6 | 216.8 | 300.4 | 309.1 | 318.1 | 327.4 | 337.0 |
| Account Receivables, % | 11.67 | 22.6 | 21.74 | 8.27 | 11.22 | 15.1 | 15.1 | 15.1 | 15.1 | 15.1 |
| Inventories | .1 | .3 | .2 | 1.8 | 2.2 | .9 | .9 | 1.0 | 1.0 | 1.0 |
| Inventories, % | 0.00307221 | 0.01573666 | 0.00609778 | 0.09160363 | 0.1153 | 0.04636163 | 0.04636163 | 0.04636163 | 0.04636163 | 0.04636163 |
| Accounts Payable | 310.7 | 563.9 | 457.9 | 411.6 | 431.0 | 395.6 | 407.2 | 419.0 | 431.3 | 443.8 |
| Accounts Payable, % | 11.72 | 27.22 | 17.52 | 20.68 | 22.3 | 19.89 | 19.89 | 19.89 | 19.89 | 19.89 |
| Capital Expenditure | -1,796.3 | -554.1 | -673.0 | -222.4 | -167.6 | -557.4 | -573.7 | -590.4 | -607.7 | -625.4 |
| Capital Expenditure, % | -67.77 | -26.75 | -25.76 | -11.17 | -8.67 | -28.02 | -28.02 | -28.02 | -28.02 | -28.02 |
| Tax Rate, % | 55.97 | 55.97 | 55.97 | 55.97 | 55.97 | 55.97 | 55.97 | 55.97 | 55.97 | 55.97 |
| EBITAT | 686.1 | 450.2 | 613.3 | 439.5 | 353.6 | 443.0 | 456.0 | 469.3 | 482.9 | 497.0 |
| Depreciation | ||||||||||
| Changes in Account Receivables | ||||||||||
| Changes in Inventories | ||||||||||
| Changes in Accounts Payable | ||||||||||
| Capital Expenditure | ||||||||||
| UFCF | -306.9 | 636.7 | 442.1 | 1,120.4 | 700.8 | 342.5 | 476.3 | 490.2 | 504.5 | 519.2 |
| WACC, % | 3.71 | 3.52 | 3.55 | 3.64 | 3.5 | 3.58 | 3.58 | 3.58 | 3.58 | 3.58 |
| PV UFCF | ||||||||||
| SUM PV UFCF | 2,089.4 | |||||||||
| Long Term Growth Rate, % | 0.50 | |||||||||
| Free cash flow (T + 1) | 522 | |||||||||
| Terminal Value | 16,926 | |||||||||
| Present Terminal Value | 14,195 | |||||||||
| Enterprise Value | 16,284 | |||||||||
| Net Debt | 5,566 | |||||||||
| Equity Value | 10,718 | |||||||||
| Diluted Shares Outstanding, MM | 428 | |||||||||
| Equity Value Per Share | 25.07 |
Benefits You Will Receive
- Flexible Forecast Inputs: Modify key assumptions (growth %, margins, WACC) effortlessly to explore various scenarios.
- Accurate Financial Data: Utilize pre-filled financial information for GuiZhou QianYuan Power Co., Ltd. (002039SZ) to facilitate your analysis.
- Automated DCF Outputs: The template generates Net Present Value (NPV) and intrinsic value calculations automatically.
- Tailored and Professional: A sophisticated Excel model designed to meet your valuation specifications.
- Designed for Analysts and Investors: Perfect for evaluating projections, confirming strategies, and enhancing efficiency.
Key Features
- Real-Life GZQY Data: Pre-filled with GuiZhou QianYuan Power Co., Ltd.'s historical financial data and future projections.
- Fully Customizable Inputs: Modify assumptions for revenue growth, profit margins, WACC, tax rates, and capital expenditures.
- Dynamic Valuation Model: Automatically updates Net Present Value (NPV) and intrinsic value based on your customized settings.
- Scenario Testing: Generate multiple forecasting scenarios to evaluate different valuation outcomes.
- User-Friendly Design: Intuitive and structured, suitable for both industry professionals and newcomers.
How It Works
- Download the Template: Gain immediate access to the Excel-based GuiZhou QianYuan Power Co., Ltd. DCF Calculator for [002039SZ].
- Input Your Assumptions: Modify the yellow-highlighted cells to set growth rates, WACC, margins, and other key parameters.
- Instant Calculations: The model automatically recalculates the intrinsic value of GuiZhou QianYuan Power Co., Ltd.
- Test Scenarios: Experiment with various assumptions to see how they impact potential valuations.
- Analyze and Decide: Leverage the outcomes to inform your investment or financial assessments.
Why Select This Calculator for GuiZhou QianYuan Power Co., Ltd. (002039SZ)?
- Designed for Industry Experts: A sophisticated tool tailored for analysts, CFOs, and consultants in the energy sector.
- Up-to-Date Financial Data: Historical and projected financial information for GuiZhou QianYuan Power preloaded for precision.
- Flexible Scenario Analysis: Effortlessly test various forecasts and assumptions.
- Comprehensive Result Outputs: Instantly calculates intrinsic value, NPV, and essential financial metrics.
- User-Friendly Interface: Step-by-step guidance ensures a smooth user experience.
Who Should Utilize This Product?
- Individual Investors: Gain insights to make educated decisions regarding the purchase or sale of GuiZhou QianYuan Power Co., Ltd. (002039SZ) shares.
- Financial Analysts: Enhance your valuation processes with accessible financial models tailored for GuiZhou QianYuan Power Co., Ltd. (002039SZ).
- Consultants: Provide clients with accurate and timely valuation insights on GuiZhou QianYuan Power Co., Ltd. (002039SZ).
- Business Owners: Learn how major companies like GuiZhou QianYuan Power Co., Ltd. (002039SZ) are valued to inform your own strategic decisions.
- Finance Students: Explore valuation methodologies through real-world data and case studies related to GuiZhou QianYuan Power Co., Ltd. (002039SZ).
Contents of the Template
- Operating and Balance Sheet Data: Pre-filled historical data and forecasts for GuiZhou QianYuan Power Co., Ltd. (002039SZ), including metrics such as revenue, EBITDA, EBIT, and capital expenditures.
- WACC Calculation: A dedicated worksheet for calculating the Weighted Average Cost of Capital (WACC), featuring key parameters like Beta, risk-free rate, and stock price.
- DCF Valuation (Unlevered and Levered): Customizable Discounted Cash Flow models that illustrate the intrinsic value with comprehensive calculations.
- Financial Statements: Pre-loaded annual and quarterly financial statements to facilitate thorough analysis.
- Key Ratios: A collection of crucial ratios including profitability, leverage, and efficiency metrics for GuiZhou QianYuan Power Co., Ltd. (002039SZ).
- Dashboard and Charts: A visual overview of valuation outputs and assumptions to easily interpret results.
Disclaimer
All information, articles, and product details provided on this website are for general informational and educational purposes only. We do not claim any ownership over, nor do we intend to infringe upon, any trademarks, copyrights, logos, brand names, or other intellectual property mentioned or depicted on this site. Such intellectual property remains the property of its respective owners, and any references here are made solely for identification or informational purposes, without implying any affiliation, endorsement, or partnership.
We make no representations or warranties, express or implied, regarding the accuracy, completeness, or suitability of any content or products presented. Nothing on this website should be construed as legal, tax, investment, financial, medical, or other professional advice. In addition, no part of this site—including articles or product references—constitutes a solicitation, recommendation, endorsement, advertisement, or offer to buy or sell any securities, franchises, or other financial instruments, particularly in jurisdictions where such activity would be unlawful.
All content is of a general nature and may not address the specific circumstances of any individual or entity. It is not a substitute for professional advice or services. Any actions you take based on the information provided here are strictly at your own risk. You accept full responsibility for any decisions or outcomes arising from your use of this website and agree to release us from any liability in connection with your use of, or reliance upon, the content or products found herein.