
|
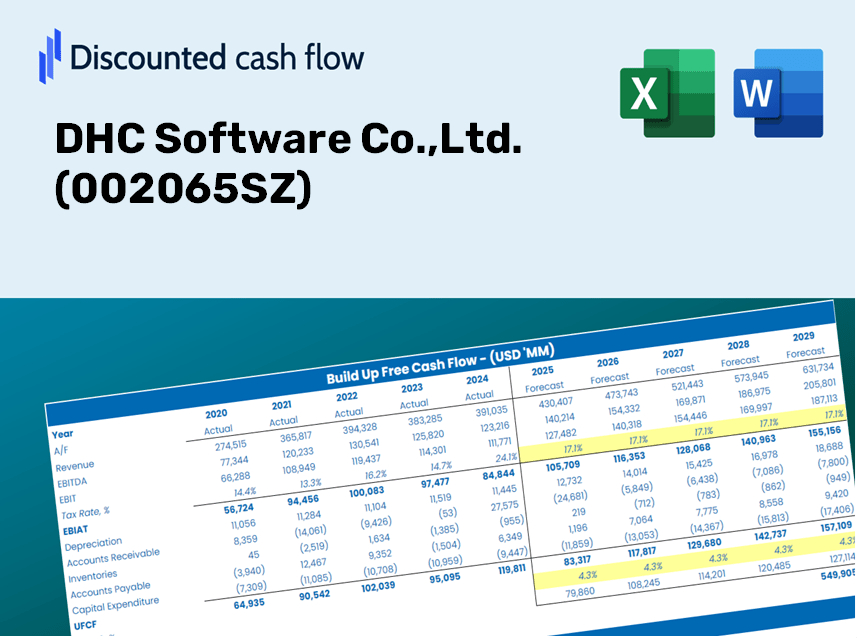
DHC Software Co.,Ltd. (002065.SZ) DCF Valuation |
Fully Editable: Tailor To Your Needs In Excel Or Sheets
Professional Design: Trusted, Industry-Standard Templates
Investor-Approved Valuation Models
MAC/PC Compatible, Fully Unlocked
No Expertise Is Needed; Easy To Follow
DHC Software Co.,Ltd. (002065.SZ) Bundle
Explore the financial prospects of DHC Software Co., Ltd. (002065SZ) with our user-friendly DCF Calculator! Enter your assumptions regarding growth, margins, and costs to calculate the intrinsic value of DHC Software Co., Ltd. (002065SZ) and enhance your investment strategy.
Discounted Cash Flow (DCF) - (USD MM)
| Year | AY1 2020 |
AY2 2021 |
AY3 2022 |
AY4 2023 |
AY5 2024 |
FY1 2025 |
FY2 2026 |
FY3 2027 |
FY4 2028 |
FY5 2029 |
|---|---|---|---|---|---|---|---|---|---|---|
| Revenue | 9,167.2 | 10,884.3 | 11,833.3 | 11,523.6 | 13,322.6 | 14,669.7 | 16,152.9 | 17,786.2 | 19,584.5 | 21,564.7 |
| Revenue Growth, % | 0 | 18.73 | 8.72 | -2.62 | 15.61 | 10.11 | 10.11 | 10.11 | 10.11 | 10.11 |
| EBITDA | 637.7 | 550.1 | 701.8 | 594.9 | 619.8 | 814.3 | 896.7 | 987.3 | 1,087.2 | 1,197.1 |
| EBITDA, % | 6.96 | 5.05 | 5.93 | 5.16 | 4.65 | 5.55 | 5.55 | 5.55 | 5.55 | 5.55 |
| Depreciation | 74.2 | 83.1 | 102.0 | 113.7 | 115.2 | 125.8 | 138.5 | 152.5 | 167.9 | 184.9 |
| Depreciation, % | 0.80993 | 0.76337 | 0.86219 | 0.98634 | 0.86457 | 0.85728 | 0.85728 | 0.85728 | 0.85728 | 0.85728 |
| EBIT | 563.4 | 467.0 | 599.8 | 481.2 | 504.6 | 688.6 | 758.2 | 834.9 | 919.3 | 1,012.2 |
| EBIT, % | 6.15 | 4.29 | 5.07 | 4.18 | 3.79 | 4.69 | 4.69 | 4.69 | 4.69 | 4.69 |
| Total Cash | 2,566.7 | 2,664.3 | 2,550.6 | 2,212.1 | 2,000.3 | 3,175.8 | 3,496.9 | 3,850.5 | 4,239.8 | 4,668.5 |
| Total Cash, percent | .0 | .0 | .0 | .0 | .0 | .0 | .0 | .0 | .0 | .0 |
| Account Receivables | 6,838.6 | 7,262.3 | 7,490.2 | 7,302.9 | 7,546.1 | 9,524.6 | 10,487.6 | 11,548.0 | 12,715.6 | 14,001.3 |
| Account Receivables, % | 74.6 | 66.72 | 63.3 | 63.37 | 56.64 | 64.93 | 64.93 | 64.93 | 64.93 | 64.93 |
| Inventories | 6,157.9 | 7,281.1 | 8,169.0 | 9,586.8 | 9,982.7 | 10,598.1 | 11,669.7 | 12,849.7 | 14,148.9 | 15,579.5 |
| Inventories, % | 67.17 | 66.9 | 69.03 | 83.19 | 74.93 | 72.25 | 72.25 | 72.25 | 72.25 | 72.25 |
| Accounts Payable | 1,578.6 | 688.6 | 650.2 | 2,123.0 | 2,236.2 | 1,885.0 | 2,075.6 | 2,285.5 | 2,516.6 | 2,771.0 |
| Accounts Payable, % | 17.22 | 6.33 | 5.49 | 18.42 | 16.78 | 12.85 | 12.85 | 12.85 | 12.85 | 12.85 |
| Capital Expenditure | -186.7 | -212.7 | -220.3 | -198.8 | -181.2 | -262.2 | -288.8 | -318.0 | -350.1 | -385.5 |
| Capital Expenditure, % | -2.04 | -1.95 | -1.86 | -1.73 | -1.36 | -1.79 | -1.79 | -1.79 | -1.79 | -1.79 |
| Tax Rate, % | -25.38 | -25.38 | -25.38 | -25.38 | -25.38 | -25.38 | -25.38 | -25.38 | -25.38 | -25.38 |
| EBITAT | 546.7 | 560.5 | 583.3 | 327.3 | 632.7 | 636.6 | 701.0 | 771.9 | 849.9 | 935.8 |
| Depreciation | ||||||||||
| Changes in Account Receivables | ||||||||||
| Changes in Inventories | ||||||||||
| Changes in Accounts Payable | ||||||||||
| Capital Expenditure | ||||||||||
| UFCF | -10,983.7 | -2,006.1 | -689.2 | 484.4 | 40.8 | -2,444.9 | -1,293.3 | -1,424.1 | -1,568.1 | -1,726.6 |
| WACC, % | 4.42 | 4.44 | 4.43 | 4.26 | 4.44 | 4.4 | 4.4 | 4.4 | 4.4 | 4.4 |
| PV UFCF | ||||||||||
| SUM PV UFCF | -7,492.3 | |||||||||
| Long Term Growth Rate, % | 3.00 | |||||||||
| Free cash flow (T + 1) | -1,778 | |||||||||
| Terminal Value | -127,123 | |||||||||
| Present Terminal Value | -102,504 | |||||||||
| Enterprise Value | -109,997 | |||||||||
| Net Debt | 3,785 | |||||||||
| Equity Value | -113,781 | |||||||||
| Diluted Shares Outstanding, MM | 3,205 | |||||||||
| Equity Value Per Share | -35.50 |
What You Will Receive
- Authentic DHC Financial Data: Pre-loaded with DHC Software Co., Ltd.'s historical and forecasted data for accurate analysis.
- Completely Customizable Template: Easily adjust key metrics such as revenue growth, WACC, and EBITDA percentage.
- Real-Time Calculations: Watch DHC's intrinsic value update automatically as you input new data.
- Expert Valuation Tool: Tailored for investors, analysts, and consultants aiming for precise DCF outcomes.
- Intuitive Design: User-friendly layout and straightforward instructions suitable for all proficiency levels.
Core Features
- Accurate Financial Data: Gain access to reliable historical data and future forecasts for DHC Software Co., Ltd. (002065SZ).
- Adjustable Forecast Parameters: Modify highlighted fields such as WACC, growth rates, and profit margins.
- Real-Time Calculations: Enjoy automatic recalculations for DCF, Net Present Value (NPV), and cash flow assessments.
- Interactive Dashboard: Utilize user-friendly charts and summaries to effectively visualize your valuation outcomes.
- Suits All Users: Designed with a straightforward structure, catering to both novice investors and experienced CFOs and consultants.
How It Works
- Step 1: Download the Excel file for DHC Software Co., Ltd. (002065SZ).
- Step 2: Examine the pre-filled financial data and forecasts for DHC Software.
- Step 3: Adjust key inputs such as revenue growth, WACC, and tax rates (highlighted cells).
- Step 4: Observe the DCF model update in real-time as you modify the assumptions.
- Step 5: Evaluate the outputs and use the findings to inform your investment decisions.
Why Choose DHC Software Co., Ltd. (002065SZ) Calculator?
- All-in-One Solution: Features DCF, WACC, and financial ratio analyses packaged together.
- Flexible Input Options: Modify the yellow-highlighted cells to explore different scenarios.
- In-Depth Analysis: Automatically computes the intrinsic value and Net Present Value for DHC Software Co., Ltd. (002065SZ).
- Integrated Data: Comes with historical and projected data for reliable baseline calculations.
- High-Quality Standards: Perfectly suited for financial analysts, investors, and business advisors.
Who Can Benefit from DHC Software Co., Ltd. (002065SZ)?
- Investors: Equip yourself with a powerful valuation tool to make informed investment decisions.
- Financial Analysts: Enhance your efficiency using our customizable DCF model that's ready to go.
- Consultants: Seamlessly modify the template for impactful client presentations and reports.
- Finance Enthusiasts: Expand your knowledge of valuation methods through practical, real-world scenarios.
- Educators and Students: Utilize this resource as a hands-on learning aid in finance-related studies.
Contents of the Template
- Preloaded DHC Data: Historical and projected financial information, encompassing revenue, EBIT, and capital expenditures.
- DCF and WACC Models: High-quality spreadsheets designed for calculating intrinsic value and Weighted Average Cost of Capital.
- Editable Inputs: Yellow-highlighted cells for modifying revenue growth, tax rates, and discount rates.
- Financial Statements: Detailed annual and quarterly financials for in-depth analysis.
- Key Ratios: Metrics for profitability, leverage, and efficiency to assess performance.
- Dashboard and Charts: Visual representations of valuation results and underlying assumptions.
Disclaimer
All information, articles, and product details provided on this website are for general informational and educational purposes only. We do not claim any ownership over, nor do we intend to infringe upon, any trademarks, copyrights, logos, brand names, or other intellectual property mentioned or depicted on this site. Such intellectual property remains the property of its respective owners, and any references here are made solely for identification or informational purposes, without implying any affiliation, endorsement, or partnership.
We make no representations or warranties, express or implied, regarding the accuracy, completeness, or suitability of any content or products presented. Nothing on this website should be construed as legal, tax, investment, financial, medical, or other professional advice. In addition, no part of this site—including articles or product references—constitutes a solicitation, recommendation, endorsement, advertisement, or offer to buy or sell any securities, franchises, or other financial instruments, particularly in jurisdictions where such activity would be unlawful.
All content is of a general nature and may not address the specific circumstances of any individual or entity. It is not a substitute for professional advice or services. Any actions you take based on the information provided here are strictly at your own risk. You accept full responsibility for any decisions or outcomes arising from your use of this website and agree to release us from any liability in connection with your use of, or reliance upon, the content or products found herein.