
|
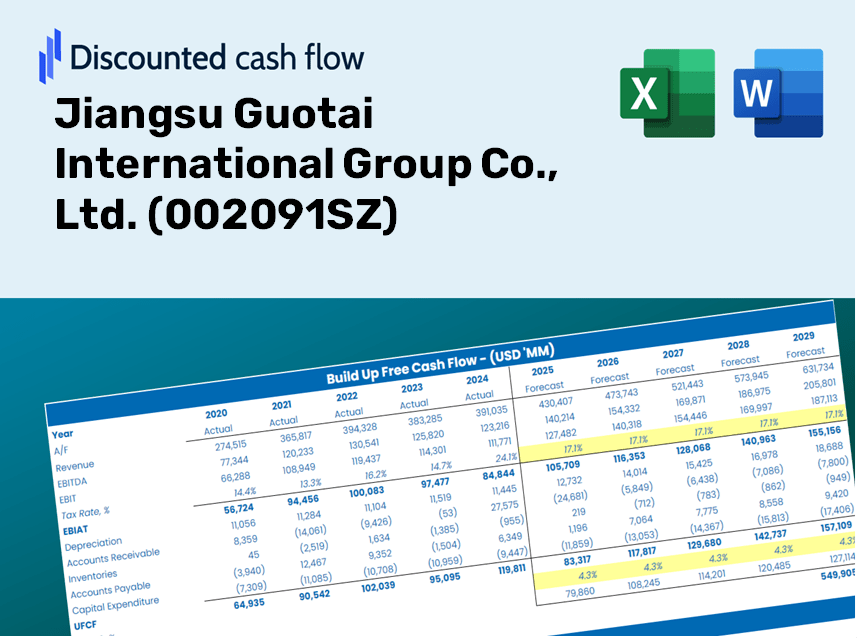
Jiangsu Guotai International Group Co., Ltd. (002091.SZ) DCF Valuation |
Fully Editable: Tailor To Your Needs In Excel Or Sheets
Professional Design: Trusted, Industry-Standard Templates
Investor-Approved Valuation Models
MAC/PC Compatible, Fully Unlocked
No Expertise Is Needed; Easy To Follow
Jiangsu Guotai International Group Co., Ltd. (002091.SZ) Bundle
Streamline Jiangsu Guotai International Group Co., Ltd. (002091SZ) valuation with this customizable DCF Calculator! With accurate financial data for Jiangsu Guotai International Group Co., Ltd. and adjustable forecast inputs, you can explore scenarios and determine the fair value of Jiangsu Guotai International Group Co., Ltd. in just minutes.
Discounted Cash Flow (DCF) - (USD MM)
| Year | AY1 2020 |
AY2 2021 |
AY3 2022 |
AY4 2023 |
AY5 2024 |
FY1 2025 |
FY2 2026 |
FY3 2027 |
FY4 2028 |
FY5 2029 |
|---|---|---|---|---|---|---|---|---|---|---|
| Revenue | 30,100.6 | 39,339.6 | 42,771.2 | 37,117.5 | 38,890.6 | 41,902.3 | 45,147.1 | 48,643.2 | 52,410.1 | 56,468.6 |
| Revenue Growth, % | 0 | 30.69 | 8.72 | -13.22 | 4.78 | 7.74 | 7.74 | 7.74 | 7.74 | 7.74 |
| EBITDA | 2,049.8 | 2,517.6 | 3,324.7 | 3,259.9 | 2,582.4 | 3,050.9 | 3,287.2 | 3,541.8 | 3,816.0 | 4,111.5 |
| EBITDA, % | 6.81 | 6.4 | 7.77 | 8.78 | 6.64 | 7.28 | 7.28 | 7.28 | 7.28 | 7.28 |
| Depreciation | 244.0 | 269.9 | 276.2 | 342.4 | 378.8 | 338.5 | 364.7 | 392.9 | 423.4 | 456.2 |
| Depreciation, % | 0.81058 | 0.68619 | 0.64583 | 0.92253 | 0.97394 | 0.80782 | 0.80782 | 0.80782 | 0.80782 | 0.80782 |
| EBIT | 1,805.8 | 2,247.6 | 3,048.5 | 2,917.5 | 2,203.6 | 2,712.5 | 2,922.5 | 3,148.8 | 3,392.7 | 3,655.4 |
| EBIT, % | 6 | 5.71 | 7.13 | 7.86 | 5.67 | 6.47 | 6.47 | 6.47 | 6.47 | 6.47 |
| Total Cash | 13,325.5 | 15,457.3 | 21,137.1 | 23,953.9 | 23,198.3 | 21,551.7 | 23,220.6 | 25,018.8 | 26,956.2 | 29,043.7 |
| Total Cash, percent | .0 | .0 | .0 | .0 | .0 | .0 | .0 | .0 | .0 | .0 |
| Account Receivables | 4,743.0 | 8,546.7 | 7,233.0 | 6,490.3 | 7,107.9 | 7,555.5 | 8,140.6 | 8,771.0 | 9,450.2 | 10,182.0 |
| Account Receivables, % | 15.76 | 21.73 | 16.91 | 17.49 | 18.28 | 18.03 | 18.03 | 18.03 | 18.03 | 18.03 |
| Inventories | 1,555.5 | 3,895.3 | 3,882.1 | 3,350.7 | 3,843.5 | 3,608.3 | 3,887.7 | 4,188.8 | 4,513.1 | 4,862.6 |
| Inventories, % | 5.17 | 9.9 | 9.08 | 9.03 | 9.88 | 8.61 | 8.61 | 8.61 | 8.61 | 8.61 |
| Accounts Payable | 8,429.5 | 9,789.4 | 10,200.4 | 4,754.3 | 11,453.6 | 9,972.5 | 10,744.8 | 11,576.8 | 12,473.3 | 13,439.2 |
| Accounts Payable, % | 28 | 24.88 | 23.85 | 12.81 | 29.45 | 23.8 | 23.8 | 23.8 | 23.8 | 23.8 |
| Capital Expenditure | -1,513.1 | -691.5 | -1,122.9 | -1,433.2 | -1,423.8 | -1,419.0 | -1,528.9 | -1,647.3 | -1,774.8 | -1,912.3 |
| Capital Expenditure, % | -5.03 | -1.76 | -2.63 | -3.86 | -3.66 | -3.39 | -3.39 | -3.39 | -3.39 | -3.39 |
| Tax Rate, % | 56.48 | 56.48 | 56.48 | 56.48 | 56.48 | 56.48 | 56.48 | 56.48 | 56.48 | 56.48 |
| EBITAT | 903.1 | 1,198.9 | 1,511.3 | 1,346.7 | 959.0 | 1,316.1 | 1,418.0 | 1,527.9 | 1,646.2 | 1,773.7 |
| Depreciation | ||||||||||
| Changes in Account Receivables | ||||||||||
| Changes in Inventories | ||||||||||
| Changes in Accounts Payable | ||||||||||
| Capital Expenditure | ||||||||||
| UFCF | 1,765.1 | -4,006.3 | 2,402.5 | -3,916.0 | 5,502.8 | -1,457.7 | 161.6 | 174.2 | 187.6 | 202.2 |
| WACC, % | 4.99 | 5.04 | 4.99 | 4.94 | 4.9 | 4.97 | 4.97 | 4.97 | 4.97 | 4.97 |
| PV UFCF | ||||||||||
| SUM PV UFCF | -778.3 | |||||||||
| Long Term Growth Rate, % | 0.50 | |||||||||
| Free cash flow (T + 1) | 203 | |||||||||
| Terminal Value | 4,544 | |||||||||
| Present Terminal Value | 3,565 | |||||||||
| Enterprise Value | 2,787 | |||||||||
| Net Debt | -6,925 | |||||||||
| Equity Value | 9,712 | |||||||||
| Diluted Shares Outstanding, MM | 1,874 | |||||||||
| Equity Value Per Share | 5.18 |
Your Benefits
- Customizable Excel Template: A fully adjustable Excel-based DCF Calculator featuring pre-filled financials for Jiangsu Guotai International Group Co., Ltd. (002091SZ).
- Real-Time Data: Access to historical performance data and forward-looking estimates (highlighted in the yellow cells).
- Adaptable Forecasting: Modify key assumptions such as revenue growth, EBITDA percentages, and WACC.
- Instant Calculations: Quickly observe how your inputs affect the valuation of Jiangsu Guotai International Group Co., Ltd. (002091SZ).
- Professional Resource: Designed for investors, CFOs, consultants, and financial analysts.
- User-Friendly Interface: Organized for ease of understanding and use, complete with step-by-step guidance.
Key Features
- Real-Life 002091SZ Data: Pre-filled with Jiangsu Guotai International Group Co., Ltd.’s historical financials and insightful projections.
- Fully Customizable Inputs: Modify revenue growth rates, profit margins, WACC, tax rates, and capital expenditures to fit your analysis.
- Dynamic Valuation Model: Automatically recalculates Net Present Value (NPV) and intrinsic value based on user-defined inputs.
- Scenario Testing: Generate various forecast scenarios to evaluate different valuation results.
- User-Friendly Design: An intuitive layout that caters to both seasoned professionals and newcomers.
How It Functions
- Obtain the Template: Gain immediate access to the Excel-based Jiangsu Guotai International Group DCF Calculator.
- Enter Your Assumptions: Modify the yellow-highlighted cells for growth rates, WACC, margins, and additional parameters.
- Real-Time Calculations: The model automatically refreshes to reflect the intrinsic value of Jiangsu Guotai International Group (002091SZ).
- Experiment with Scenarios: Test various assumptions to assess potential changes in valuation.
- Evaluate and Decide: Utilize the outcomes to inform your investment decisions or financial analysis.
Why Opt for This Calculator for Jiangsu Guotai International Group Co., Ltd. (002091SZ)?
- Designed for Experts: A sophisticated tool utilized by financial analysts, CFOs, and consultants alike.
- Accurate Financial Data: Historical and projected financials for Jiangsu Guotai International Group preloaded for reliability.
- Flexible Scenario Analysis: Effortlessly test various forecasts and assumptions.
- Comprehensive Outputs: Automatically computes intrinsic value, NPV, and essential metrics.
- User-Friendly: Detailed step-by-step instructions ensure a seamless experience.
Who Should Utilize This Product?
- Investors: Precisely assess Jiangsu Guotai International Group Co., Ltd.'s fair value before making investment choices.
- CFOs: Employ a high-quality DCF model for financial reporting and strategic analysis.
- Consultants: Swiftly modify the template for client valuation reports.
- Entrepreneurs: Acquire knowledge on financial modeling techniques used by leading corporations.
- Educators: Utilize it as an instructional resource to showcase valuation methods.
What the Template Contains
- Preloaded 002091SZ Data: Historical and projected financial information, such as revenue, EBIT, and capital expenditures.
- DCF and WACC Models: Advanced spreadsheets for determining intrinsic value and the Weighted Average Cost of Capital.
- Editable Inputs: Yellow-highlighted cells for modifying revenue growth rates, tax rates, and discount rates.
- Financial Statements: Detailed annual and quarterly financial reports for in-depth analysis.
- Key Ratios: Metrics on profitability, leverage, and efficiency to assess financial performance.
- Dashboard and Charts: Visual representations of valuation results and underlying assumptions.
Disclaimer
All information, articles, and product details provided on this website are for general informational and educational purposes only. We do not claim any ownership over, nor do we intend to infringe upon, any trademarks, copyrights, logos, brand names, or other intellectual property mentioned or depicted on this site. Such intellectual property remains the property of its respective owners, and any references here are made solely for identification or informational purposes, without implying any affiliation, endorsement, or partnership.
We make no representations or warranties, express or implied, regarding the accuracy, completeness, or suitability of any content or products presented. Nothing on this website should be construed as legal, tax, investment, financial, medical, or other professional advice. In addition, no part of this site—including articles or product references—constitutes a solicitation, recommendation, endorsement, advertisement, or offer to buy or sell any securities, franchises, or other financial instruments, particularly in jurisdictions where such activity would be unlawful.
All content is of a general nature and may not address the specific circumstances of any individual or entity. It is not a substitute for professional advice or services. Any actions you take based on the information provided here are strictly at your own risk. You accept full responsibility for any decisions or outcomes arising from your use of this website and agree to release us from any liability in connection with your use of, or reliance upon, the content or products found herein.