
|
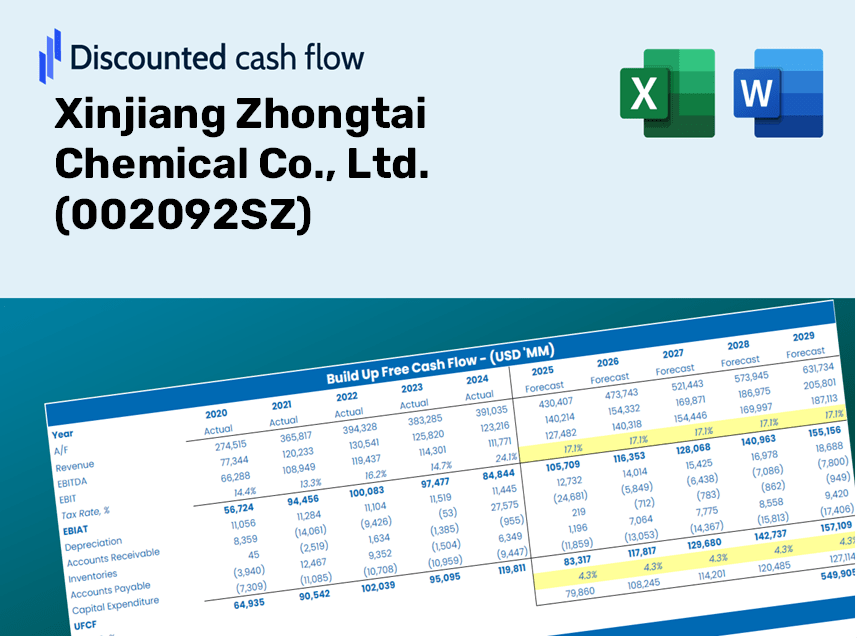
Xinjiang Zhongtai Chemical Co., Ltd. (002092.SZ) DCF Valuation |
Fully Editable: Tailor To Your Needs In Excel Or Sheets
Professional Design: Trusted, Industry-Standard Templates
Investor-Approved Valuation Models
MAC/PC Compatible, Fully Unlocked
No Expertise Is Needed; Easy To Follow
Xinjiang Zhongtai Chemical Co., Ltd. (002092.SZ) Bundle
Whether you’re an investor or analyst, this (002092SZ) DCF Calculator is your go-to resource for accurate valuation. Loaded with real data from Xinjiang Zhongtai Chemical Co., Ltd., you can adjust forecasts and view the effects in real time.
Discounted Cash Flow (DCF) - (USD MM)
| Year | AY1 2020 |
AY2 2021 |
AY3 2022 |
AY4 2023 |
AY5 2024 |
FY1 2025 |
FY2 2026 |
FY3 2027 |
FY4 2028 |
FY5 2029 |
|---|---|---|---|---|---|---|---|---|---|---|
| Revenue | 84,214.7 | 62,893.4 | 51,662.1 | 37,118.0 | 30,123.3 | 23,332.6 | 18,072.7 | 13,998.6 | 10,842.9 | 8,398.6 |
| Revenue Growth, % | 0 | -25.32 | -17.86 | -28.15 | -18.84 | -22.54 | -22.54 | -22.54 | -22.54 | -22.54 |
| EBITDA | 3,270.9 | 7,182.5 | 4,579.8 | 1,446.8 | 3,654.4 | 1,875.9 | 1,453.0 | 1,125.4 | 871.7 | 675.2 |
| EBITDA, % | 3.88 | 11.42 | 8.86 | 3.9 | 12.13 | 8.04 | 8.04 | 8.04 | 8.04 | 8.04 |
| Depreciation | 1,977.3 | 2,281.3 | 2,461.3 | 2,631.1 | 3,077.9 | 1,308.8 | 1,013.7 | 785.2 | 608.2 | 471.1 |
| Depreciation, % | 2.35 | 3.63 | 4.76 | 7.09 | 10.22 | 5.61 | 5.61 | 5.61 | 5.61 | 5.61 |
| EBIT | 1,293.6 | 4,901.2 | 2,118.6 | -1,184.3 | 576.4 | 567.1 | 439.3 | 340.2 | 263.5 | 204.1 |
| EBIT, % | 1.54 | 7.79 | 4.1 | -3.19 | 1.91 | 2.43 | 2.43 | 2.43 | 2.43 | 2.43 |
| Total Cash | 5,155.1 | 4,783.6 | 8,117.1 | 4,229.0 | 4,768.9 | 2,644.2 | 2,048.2 | 1,586.4 | 1,228.8 | 951.8 |
| Total Cash, percent | .0 | .0 | .0 | .0 | .0 | .0 | .0 | .0 | .0 | .0 |
| Account Receivables | 10,995.2 | 11,444.1 | 9,261.2 | 4,645.3 | 3,880.8 | 3,480.1 | 2,695.6 | 2,087.9 | 1,617.3 | 1,252.7 |
| Account Receivables, % | 13.06 | 18.2 | 17.93 | 12.51 | 12.88 | 14.92 | 14.92 | 14.92 | 14.92 | 14.92 |
| Inventories | 1,906.6 | 2,746.9 | 3,512.1 | 3,318.5 | 3,130.2 | 1,528.8 | 1,184.2 | 917.2 | 710.5 | 550.3 |
| Inventories, % | 2.26 | 4.37 | 6.8 | 8.94 | 10.39 | 6.55 | 6.55 | 6.55 | 6.55 | 6.55 |
| Accounts Payable | 6,697.3 | 8,359.7 | 12,404.1 | 8,547.2 | 9,398.9 | 4,642.4 | 3,595.9 | 2,785.2 | 2,157.4 | 1,671.0 |
| Accounts Payable, % | 7.95 | 13.29 | 24.01 | 23.03 | 31.2 | 19.9 | 19.9 | 19.9 | 19.9 | 19.9 |
| Capital Expenditure | -1,977.2 | -1,650.3 | -5,297.5 | -4,270.1 | -2,938.3 | -1,702.5 | -1,318.7 | -1,021.5 | -791.2 | -612.8 |
| Capital Expenditure, % | -2.35 | -2.62 | -10.25 | -11.5 | -9.75 | -7.3 | -7.3 | -7.3 | -7.3 | -7.3 |
| Tax Rate, % | 13.23 | 13.23 | 13.23 | 13.23 | 13.23 | 13.23 | 13.23 | 13.23 | 13.23 | 13.23 |
| EBITAT | 1,109.6 | 3,693.5 | 1,165.8 | -1,053.4 | 500.2 | 444.5 | 344.3 | 266.7 | 206.6 | 160.0 |
| Depreciation | ||||||||||
| Changes in Account Receivables | ||||||||||
| Changes in Inventories | ||||||||||
| Changes in Accounts Payable | ||||||||||
| Capital Expenditure | ||||||||||
| UFCF | -5,094.9 | 4,697.8 | 3,791.6 | -1,739.8 | 2,444.3 | -2,703.8 | 121.9 | 94.4 | 73.1 | 56.6 |
| WACC, % | 6.1 | 5.7 | 4.93 | 6.22 | 6.13 | 5.81 | 5.81 | 5.81 | 5.81 | 5.81 |
| PV UFCF | ||||||||||
| SUM PV UFCF | -2,265.6 | |||||||||
| Long Term Growth Rate, % | 2.00 | |||||||||
| Free cash flow (T + 1) | 58 | |||||||||
| Terminal Value | 1,515 | |||||||||
| Present Terminal Value | 1,142 | |||||||||
| Enterprise Value | -1,124 | |||||||||
| Net Debt | 11,448 | |||||||||
| Equity Value | -12,571 | |||||||||
| Diluted Shares Outstanding, MM | 2,576 | |||||||||
| Equity Value Per Share | -4.88 |
What You Will Gain
- Authentic Xinjiang Zhongtai Data: Preloaded financial metrics – including revenue and EBIT – derived from actual and forecasted figures.
- Comprehensive Customization: Modify all essential parameters (highlighted cells) such as WACC, growth rate, and tax rates.
- Real-Time Valuation Adjustments: Automatic recalculations to assess the effects of changes on the fair value of Xinjiang Zhongtai Chemical (002092SZ).
- Flexible Excel Template: Designed for easy edits, scenario analysis, and in-depth projections.
- Efficient and Reliable: Avoid the hassle of building models from the ground up while ensuring accuracy and adaptability.
Key Features
- Real-Time XZCC Data: Pre-filled with Xinjiang Zhongtai Chemical's historical financials and future projections.
- Completely Customizable Inputs: Modify revenue growth, profit margins, discount rates, tax rates, and capital expenditures.
- Interactive Valuation Model: Automatically recalculates Net Present Value (NPV) and intrinsic value based on your parameters.
- Scenario Analysis: Develop various forecasting scenarios to evaluate different valuation results.
- User-Friendly Interface: Designed to be straightforward and accessible for both professionals and newcomers.
How It Works
- Download: Access the pre-prepared Excel file containing Xinjiang Zhongtai Chemical Co., Ltd.'s (002092SZ) financial data.
- Customize: Modify forecasts, such as revenue growth, EBITDA %, and WACC according to your analysis.
- Update Automatically: The intrinsic value and NPV calculations refresh in real-time with any changes made.
- Test Scenarios: Generate various projections and instantly compare the results.
- Make Decisions: Utilize the valuation outcomes to inform your investment strategies for Xinjiang Zhongtai Chemical Co., Ltd. (002092SZ).
Why Choose Our Calculator for Xinjiang Zhongtai Chemical Co., Ltd. (002092SZ)?
- Time Efficient: Skip the hassle of building a DCF model from the ground up – it's ready for immediate use.
- Enhanced Precision: Dependable financial data and calculations minimize valuation errors.
- Completely Customizable: Adjust the model to align with your specific assumptions and forecasts.
- User-Friendly: Intuitive charts and outputs simplify result interpretation.
- Rely on Industry Professionals: Crafted for users who prioritize accuracy and functionality.
Who Can Benefit from This Product?
- Institutional Investors: Develop accurate and detailed valuation models for analyzing portfolios related to Xinjiang Zhongtai Chemical Co., Ltd. (002092SZ).
- Corporate Finance Departments: Evaluate valuation scenarios to inform strategic decision-making for the organization.
- Financial Consultants: Deliver precise valuation insights to clients investing in Xinjiang Zhongtai Chemical Co., Ltd. (002092SZ).
- Academics and Students: Leverage real-world data to learn and teach advanced financial modeling techniques.
- Industry Analysts: Gain insights into the market valuation of chemical companies like Xinjiang Zhongtai Chemical Co., Ltd. (002092SZ).
What the Template Contains
- Preloaded XJZ Data: Historical and projected financial information, encompassing revenue, EBIT, and capital expenditures.
- DCF and WACC Models: Advanced spreadsheets for calculating intrinsic value and the Weighted Average Cost of Capital.
- Editable Inputs: Yellow-highlighted fields for modifying revenue growth, tax rates, and discount rates.
- Financial Statements: Detailed annual and quarterly financial reports for in-depth analysis.
- Key Ratios: Metrics for profitability, leverage, and efficiency to assess performance.
- Dashboard and Charts: Visual representations of valuation results and underlying assumptions.
Disclaimer
All information, articles, and product details provided on this website are for general informational and educational purposes only. We do not claim any ownership over, nor do we intend to infringe upon, any trademarks, copyrights, logos, brand names, or other intellectual property mentioned or depicted on this site. Such intellectual property remains the property of its respective owners, and any references here are made solely for identification or informational purposes, without implying any affiliation, endorsement, or partnership.
We make no representations or warranties, express or implied, regarding the accuracy, completeness, or suitability of any content or products presented. Nothing on this website should be construed as legal, tax, investment, financial, medical, or other professional advice. In addition, no part of this site—including articles or product references—constitutes a solicitation, recommendation, endorsement, advertisement, or offer to buy or sell any securities, franchises, or other financial instruments, particularly in jurisdictions where such activity would be unlawful.
All content is of a general nature and may not address the specific circumstances of any individual or entity. It is not a substitute for professional advice or services. Any actions you take based on the information provided here are strictly at your own risk. You accept full responsibility for any decisions or outcomes arising from your use of this website and agree to release us from any liability in connection with your use of, or reliance upon, the content or products found herein.