
|
YUNDA Holding Co., Ltd. (002120.SZ) DCF Valuation |
Fully Editable: Tailor To Your Needs In Excel Or Sheets
Professional Design: Trusted, Industry-Standard Templates
Investor-Approved Valuation Models
MAC/PC Compatible, Fully Unlocked
No Expertise Is Needed; Easy To Follow
YUNDA Holding Co., Ltd. (002120.SZ) Bundle
Discover the true value of YUNDA Holding Co., Ltd. (002120SZ) with our advanced DCF Calculator! Adjust key assumptions, explore various scenarios, and evaluate how changes affect the valuation of YUNDA Holding Co., Ltd. (002120SZ) – all within a convenient Excel template.
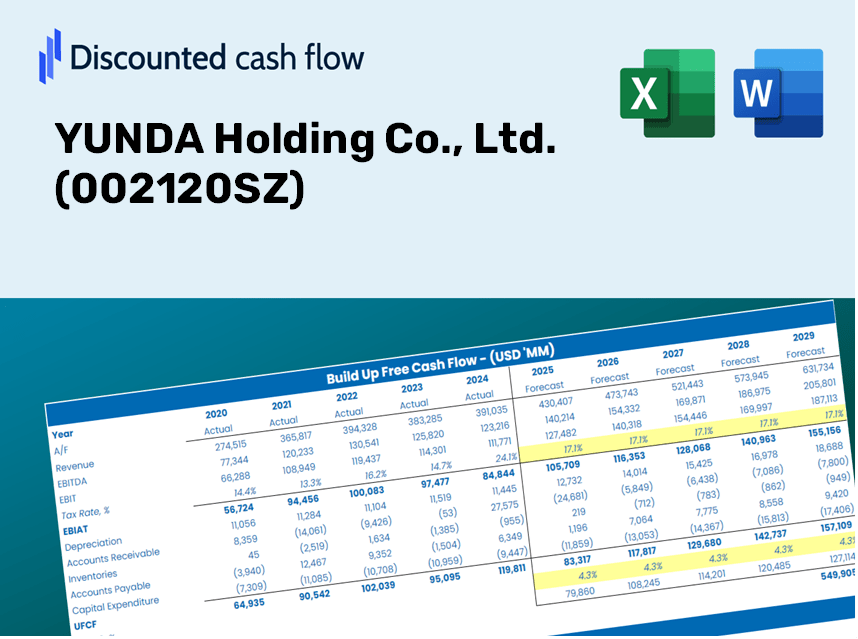
Discounted Cash Flow (DCF) - (USD MM)
| Year | AY1 2020 |
AY2 2021 |
AY3 2022 |
AY4 2023 |
AY5 2024 |
FY1 2025 |
FY2 2026 |
FY3 2027 |
FY4 2028 |
FY5 2029 |
|---|---|---|---|---|---|---|---|---|---|---|
| Revenue | 33,500.4 | 41,735.6 | 47,433.7 | 44,982.5 | 48,543.0 | 53,143.7 | 58,180.5 | 63,694.6 | 69,731.3 | 76,340.2 |
| Revenue Growth, % | 0 | 24.58 | 13.65 | -5.17 | 7.92 | 9.48 | 9.48 | 9.48 | 9.48 | 9.48 |
| EBITDA | 2,911.5 | 3,797.1 | 4,448.2 | 4,483.0 | 4,442.2 | 4,919.4 | 5,385.7 | 5,896.1 | 6,454.9 | 7,066.7 |
| EBITDA, % | 8.69 | 9.1 | 9.38 | 9.97 | 9.15 | 9.26 | 9.26 | 9.26 | 9.26 | 9.26 |
| Depreciation | 1,364.0 | 1,849.0 | 2,195.6 | 2,162.4 | 1,750.0 | 2,289.7 | 2,506.7 | 2,744.3 | 3,004.4 | 3,289.2 |
| Depreciation, % | 4.07 | 4.43 | 4.63 | 4.81 | 3.61 | 4.31 | 4.31 | 4.31 | 4.31 | 4.31 |
| EBIT | 1,547.6 | 1,948.1 | 2,252.6 | 2,320.6 | 2,692.2 | 2,629.7 | 2,878.9 | 3,151.8 | 3,450.5 | 3,777.5 |
| EBIT, % | 4.62 | 4.67 | 4.75 | 5.16 | 5.55 | 4.95 | 4.95 | 4.95 | 4.95 | 4.95 |
| Total Cash | 10,515.4 | 6,791.5 | 8,068.2 | 8,839.1 | 11,878.0 | 11,563.0 | 12,658.9 | 13,858.7 | 15,172.2 | 16,610.1 |
| Total Cash, percent | .0 | .0 | .0 | .0 | .0 | .0 | .0 | .0 | .0 | .0 |
| Account Receivables | 676.9 | 1,514.3 | 1,718.9 | 1,514.2 | 1,218.3 | 1,610.1 | 1,762.7 | 1,929.7 | 2,112.6 | 2,312.9 |
| Account Receivables, % | 2.02 | 3.63 | 3.62 | 3.37 | 2.51 | 3.03 | 3.03 | 3.03 | 3.03 | 3.03 |
| Inventories | 130.2 | 180.8 | 208.4 | 158.1 | 138.4 | 201.7 | 220.8 | 241.8 | 264.7 | 289.8 |
| Inventories, % | 0.38851 | 0.43331 | 0.43933 | 0.35145 | 0.28518 | 0.37956 | 0.37956 | 0.37956 | 0.37956 | 0.37956 |
| Accounts Payable | 4,348.3 | 3,631.6 | 5,321.8 | 3,522.2 | 3,197.0 | 5,029.2 | 5,505.8 | 6,027.6 | 6,598.9 | 7,224.3 |
| Accounts Payable, % | 12.98 | 8.7 | 11.22 | 7.83 | 6.59 | 9.46 | 9.46 | 9.46 | 9.46 | 9.46 |
| Capital Expenditure | -6,003.6 | -8,244.5 | -3,523.6 | -2,571.2 | -2,435.5 | -5,934.7 | -6,497.2 | -7,113.0 | -7,787.1 | -8,525.2 |
| Capital Expenditure, % | -17.92 | -19.75 | -7.43 | -5.72 | -5.02 | -11.17 | -11.17 | -11.17 | -11.17 | -11.17 |
| Tax Rate, % | 26.75 | 26.75 | 26.75 | 26.75 | 26.75 | 26.75 | 26.75 | 26.75 | 26.75 | 26.75 |
| EBITAT | 1,240.6 | 1,543.8 | 1,722.7 | 1,725.0 | 1,971.9 | 2,016.8 | 2,207.9 | 2,417.2 | 2,646.3 | 2,897.1 |
| Depreciation | ||||||||||
| Changes in Account Receivables | ||||||||||
| Changes in Inventories | ||||||||||
| Changes in Accounts Payable | ||||||||||
| Capital Expenditure | ||||||||||
| UFCF | 142.2 | -6,456.5 | 1,852.8 | -228.4 | 1,276.9 | -251.2 | -1,477.6 | -1,617.7 | -1,771.0 | -1,938.8 |
| WACC, % | 4.67 | 4.66 | 4.62 | 4.6 | 4.58 | 4.63 | 4.63 | 4.63 | 4.63 | 4.63 |
| PV UFCF | ||||||||||
| SUM PV UFCF | -6,026.6 | |||||||||
| Long Term Growth Rate, % | 3.50 | |||||||||
| Free cash flow (T + 1) | -2,007 | |||||||||
| Terminal Value | -178,079 | |||||||||
| Present Terminal Value | -142,035 | |||||||||
| Enterprise Value | -148,062 | |||||||||
| Net Debt | 2,299 | |||||||||
| Equity Value | -150,361 | |||||||||
| Diluted Shares Outstanding, MM | 2,990 | |||||||||
| Equity Value Per Share | -50.28 |
Benefits of Choosing YUNDA Holding Co., Ltd. (002120SZ)
- Comprehensive YUNDA Financials: Access historical and projected data for precise valuation.
- Customizable Assumptions: Adjust WACC, tax rates, revenue growth, and capital expenditures as needed.
- Real-Time Calculations: Automatically compute intrinsic value and NPV.
- Scenario Exploration: Analyze various scenarios to assess YUNDA's potential future performance.
- User-Friendly Interface: Designed for industry professionals while remaining easy for newcomers.
Key Features
- Customizable Forecast Inputs: Adjust vital metrics such as revenue growth, EBITDA %, and capital expenditures to fit your analysis.
- Instant DCF Valuation: Quickly calculates intrinsic value, NPV, and other essential outputs at the click of a button.
- Top-Tier Accuracy: Utilizes YUNDA Holding Co., Ltd.’s (002120SZ) real-world financial data for precise valuation results.
- Simplified Scenario Analysis: Effortlessly evaluate various assumptions and analyze different outcomes in one platform.
- Efficiency Booster: Streamline your workflow by avoiding the complexity of building valuation models from the ground up.
How It Functions
- Download: Obtain the pre-prepared Excel file containing YUNDA Holding Co., Ltd.'s (002120SZ) financial data.
- Customize: Modify forecasts such as revenue growth, EBITDA %, and WACC according to your preferences.
- Update Automatically: Enjoy real-time updates to intrinsic value and NPV calculations.
- Test Scenarios: Develop various projections and easily compare their results.
- Make Decisions: Utilize the valuation outputs to inform your investment strategy.
Why Choose the YUNDA Holding Co., Ltd. ([002120SZ]) Calculator?
- Accurate Data: Access to genuine YUNDA financials guarantees dependable valuation outcomes.
- Customizable: Tailor essential inputs such as growth rates, WACC, and tax rates to align with your forecasts.
- Time-Saving: Pre-configured calculations save you the hassle of starting from ground zero.
- Professional-Grade Tool: Crafted for investors, analysts, and consultants in mind.
- User-Friendly: An intuitive interface combined with clear, step-by-step guidance makes it accessible for every user.
Who Can Benefit from This Product?
- Investors: Evaluate YUNDA Holding Co., Ltd.'s (002120SZ) valuation before making investment decisions.
- CFOs and Financial Analysts: Enhance valuation processes and validate financial models.
- Startup Founders: Gain insights into the valuation methods used for established companies like YUNDA Holding Co., Ltd. (002120SZ).
- Consultants: Provide comprehensive valuation reports to your clients based on YUNDA Holding Co., Ltd. (002120SZ).
- Students and Educators: Utilize practical examples from YUNDA Holding Co., Ltd. (002120SZ) to learn and teach valuation techniques.
What the Template Includes
- Pre-Filled DCF Model: YUNDA Holding Co., Ltd.’s ([002120SZ]) financial data preloaded for immediate application.
- WACC Calculator: Comprehensive calculations for Weighted Average Cost of Capital.
- Financial Ratios: Assess YUNDA’s ([002120SZ]) profitability, leverage, and operational efficiency.
- Editable Inputs: Modify assumptions such as growth rates, profit margins, and CAPEX to suit your scenarios.
- Financial Statements: Annual and quarterly reports provided for thorough analysis.
- Interactive Dashboard: Easily visualize essential valuation metrics and outcomes.
Disclaimer
All information, articles, and product details provided on this website are for general informational and educational purposes only. We do not claim any ownership over, nor do we intend to infringe upon, any trademarks, copyrights, logos, brand names, or other intellectual property mentioned or depicted on this site. Such intellectual property remains the property of its respective owners, and any references here are made solely for identification or informational purposes, without implying any affiliation, endorsement, or partnership.
We make no representations or warranties, express or implied, regarding the accuracy, completeness, or suitability of any content or products presented. Nothing on this website should be construed as legal, tax, investment, financial, medical, or other professional advice. In addition, no part of this site—including articles or product references—constitutes a solicitation, recommendation, endorsement, advertisement, or offer to buy or sell any securities, franchises, or other financial instruments, particularly in jurisdictions where such activity would be unlawful.
All content is of a general nature and may not address the specific circumstances of any individual or entity. It is not a substitute for professional advice or services. Any actions you take based on the information provided here are strictly at your own risk. You accept full responsibility for any decisions or outcomes arising from your use of this website and agree to release us from any liability in connection with your use of, or reliance upon, the content or products found herein.