
|
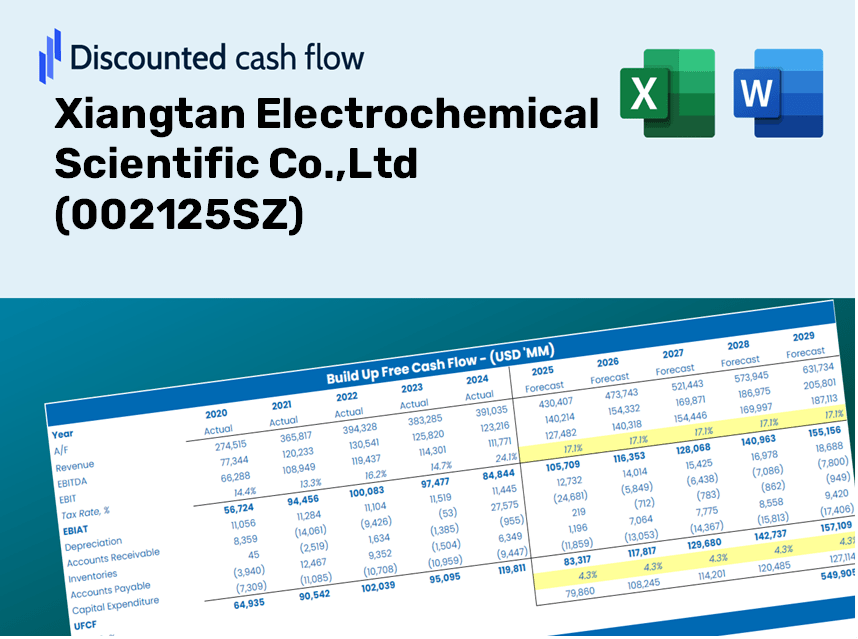
Xiangtan Electrochemical Scientific Co.,Ltd (002125.SZ) DCF Valuation |
Fully Editable: Tailor To Your Needs In Excel Or Sheets
Professional Design: Trusted, Industry-Standard Templates
Investor-Approved Valuation Models
MAC/PC Compatible, Fully Unlocked
No Expertise Is Needed; Easy To Follow
Xiangtan Electrochemical Scientific Co.,Ltd (002125.SZ) Bundle
Explore the financial prospects of Xiangtan Electrochemical Scientific Co., Ltd with our user-friendly DCF Calculator! Enter your assumptions regarding growth, margins, and costs to uncover the intrinsic value of Xiangtan Electrochemical Scientific Co., Ltd (002125SZ) and enhance your investment strategy.
Discounted Cash Flow (DCF) - (USD MM)
| Year | AY1 2020 |
AY2 2021 |
AY3 2022 |
AY4 2023 |
AY5 2024 |
FY1 2025 |
FY2 2026 |
FY3 2027 |
FY4 2028 |
FY5 2029 |
|---|---|---|---|---|---|---|---|---|---|---|
| Revenue | 1,234.2 | 1,871.5 | 2,100.3 | 2,163.5 | 1,912.4 | 2,176.7 | 2,477.5 | 2,819.8 | 3,209.4 | 3,652.9 |
| Revenue Growth, % | 0 | 51.64 | 12.22 | 3.01 | -11.6 | 13.82 | 13.82 | 13.82 | 13.82 | 13.82 |
| EBITDA | 248.5 | 339.2 | 391.3 | 499.8 | 525.2 | 467.8 | 532.4 | 606.0 | 689.7 | 785.0 |
| EBITDA, % | 20.13 | 18.12 | 18.63 | 23.1 | 27.46 | 21.49 | 21.49 | 21.49 | 21.49 | 21.49 |
| Depreciation | 151.9 | 154.8 | 171.0 | 196.0 | 199.1 | 209.8 | 238.8 | 271.8 | 309.3 | 352.1 |
| Depreciation, % | 12.31 | 8.27 | 8.14 | 9.06 | 10.41 | 9.64 | 9.64 | 9.64 | 9.64 | 9.64 |
| EBIT | 96.6 | 184.4 | 220.3 | 303.8 | 326.1 | 258.0 | 293.6 | 334.2 | 380.4 | 432.9 |
| EBIT, % | 7.82 | 9.85 | 10.49 | 14.04 | 17.05 | 11.85 | 11.85 | 11.85 | 11.85 | 11.85 |
| Total Cash | 185.3 | 229.2 | 284.7 | 480.6 | 487.7 | 385.4 | 438.7 | 499.3 | 568.3 | 646.8 |
| Total Cash, percent | .0 | .0 | .0 | .0 | .0 | .0 | .0 | .0 | .0 | .0 |
| Account Receivables | 449.6 | 766.1 | 948.0 | 783.3 | 534.2 | 812.5 | 924.8 | 1,052.6 | 1,198.0 | 1,363.5 |
| Account Receivables, % | 36.43 | 40.94 | 45.13 | 36.2 | 27.93 | 37.33 | 37.33 | 37.33 | 37.33 | 37.33 |
| Inventories | 532.3 | 572.3 | 645.9 | 375.5 | 376.5 | 616.0 | 701.1 | 798.0 | 908.3 | 1,033.8 |
| Inventories, % | 43.13 | 30.58 | 30.75 | 17.35 | 19.69 | 28.3 | 28.3 | 28.3 | 28.3 | 28.3 |
| Accounts Payable | 375.3 | 572.0 | 770.2 | 365.6 | 365.9 | 581.9 | 662.4 | 753.9 | 858.0 | 976.6 |
| Accounts Payable, % | 30.41 | 30.56 | 36.67 | 16.9 | 19.13 | 26.74 | 26.74 | 26.74 | 26.74 | 26.74 |
| Capital Expenditure | -203.2 | -272.1 | -185.2 | -129.5 | -119.9 | -226.7 | -258.0 | -293.7 | -334.3 | -380.4 |
| Capital Expenditure, % | -16.46 | -14.54 | -8.82 | -5.98 | -6.27 | -10.41 | -10.41 | -10.41 | -10.41 | -10.41 |
| Tax Rate, % | 11.5 | 11.5 | 11.5 | 11.5 | 11.5 | 11.5 | 11.5 | 11.5 | 11.5 | 11.5 |
| EBITAT | 96.8 | 150.9 | 203.1 | 277.3 | 288.6 | 234.1 | 266.5 | 303.3 | 345.2 | 392.9 |
| Depreciation | ||||||||||
| Changes in Account Receivables | ||||||||||
| Changes in Inventories | ||||||||||
| Changes in Accounts Payable | ||||||||||
| Capital Expenditure | ||||||||||
| UFCF | -561.0 | -126.4 | 131.7 | 374.2 | 616.2 | -84.6 | 130.3 | 148.3 | 168.7 | 192.1 |
| WACC, % | 5.1 | 5.03 | 5.07 | 5.07 | 5.06 | 5.07 | 5.07 | 5.07 | 5.07 | 5.07 |
| PV UFCF | ||||||||||
| SUM PV UFCF | 453.8 | |||||||||
| Long Term Growth Rate, % | 4.00 | |||||||||
| Free cash flow (T + 1) | 200 | |||||||||
| Terminal Value | 18,731 | |||||||||
| Present Terminal Value | 14,630 | |||||||||
| Enterprise Value | 15,084 | |||||||||
| Net Debt | 675 | |||||||||
| Equity Value | 14,409 | |||||||||
| Diluted Shares Outstanding, MM | 630 | |||||||||
| Equity Value Per Share | 22.87 |
What You Will Receive
- Genuine 002125 Financials: Access to both historical and projected financial data for precise valuation.
- Customizable Parameters: Adjust WACC, tax rates, revenue growth, and capital expenditures to fit your analysis.
- Automated Calculations: Intrinsic value and NPV are calculated in real-time.
- Scenario Testing: Explore various scenarios to assess the future performance of Xiangtan Electrochemical Scientific Co., Ltd.
- User-Friendly Design: Designed for industry experts while remaining easy to use for newcomers.
Key Features
- 🔍 Real-Life (002125SZ) Financials: Pre-loaded historical and forecasted data for Xiangtan Electrochemical Scientific Co., Ltd.
- ✏️ Fully Customizable Inputs: Modify all essential parameters (highlighted cells) such as WACC, growth %, and tax rates.
- 📊 Professional DCF Valuation: Integrated formulas compute the intrinsic value of Xiangtan using the Discounted Cash Flow approach.
- ⚡ Instant Results: See Xiangtan's valuation in real-time after making your adjustments.
- Scenario Analysis: Evaluate and contrast different outcomes based on varying financial assumptions side-by-side.
How It Works
- 1. Access the Template: Download and open the Excel file containing Xiangtan Electrochemical Scientific Co.,Ltd's preloaded data.
- 2. Modify Assumptions: Adjust key variables such as growth rates, WACC, and capital expenditures.
- 3. View Results in Real-Time: The DCF model automatically computes intrinsic value and NPV.
- 4. Explore Scenarios: Analyze various forecasts to evaluate different valuation results.
- 5. Present with Assurance: Deliver professional valuation insights to guide your strategic decisions.
Why Select This Calculator for Xiangtan Electrochemical?
- All-in-One Solution: Combines DCF, WACC, and financial ratio analysis in a single platform.
- Flexible Parameters: Modify the yellow-highlighted fields to explore different scenarios.
- In-Depth Analysis: Automatically evaluates the intrinsic value and Net Present Value for Xiangtan Electrochemical (002125SZ).
- Prepopulated Information: Access historical and projected data for reliable starting points.
- High-Caliber Performance: Perfect for financial analysts, investors, and business advisors.
Who Can Benefit from This Product?
- Investors: Evaluate Xiangtan Electrochemical Scientific Co.,Ltd's ([002125SZ]) valuation prior to making investment decisions.
- CFOs and Financial Analysts: Enhance valuation methodologies and assess financial projections for ([002125SZ]).
- Startup Founders: Gain insights into how established companies like ([002125SZ]) are valued in the market.
- Consultants: Create detailed valuation reports tailored for clients regarding ([002125SZ]).
- Students and Educators: Utilize real-world examples from ([002125SZ]) to teach and practice valuation skills.
Contents of the Template
- Operating and Balance Sheet Data: Pre-filled historical data and forecasts for Xiangtan Electrochemical Scientific Co.,Ltd (002125SZ), including revenue, EBITDA, EBIT, and capital expenditures.
- WACC Calculation: A dedicated worksheet for calculating the Weighted Average Cost of Capital (WACC), featuring parameters such as Beta, risk-free rate, and share price.
- DCF Valuation (Unlevered and Levered): Customizable Discounted Cash Flow models that showcase intrinsic value with comprehensive calculations.
- Financial Statements: Pre-loaded annual and quarterly financial statements to facilitate in-depth analysis.
- Key Ratios: A collection of profitability, leverage, and efficiency ratios specific to Xiangtan Electrochemical Scientific Co.,Ltd (002125SZ).
- Dashboard and Charts: Visual representations of valuation results and assumptions for straightforward analysis of outcomes.
Disclaimer
All information, articles, and product details provided on this website are for general informational and educational purposes only. We do not claim any ownership over, nor do we intend to infringe upon, any trademarks, copyrights, logos, brand names, or other intellectual property mentioned or depicted on this site. Such intellectual property remains the property of its respective owners, and any references here are made solely for identification or informational purposes, without implying any affiliation, endorsement, or partnership.
We make no representations or warranties, express or implied, regarding the accuracy, completeness, or suitability of any content or products presented. Nothing on this website should be construed as legal, tax, investment, financial, medical, or other professional advice. In addition, no part of this site—including articles or product references—constitutes a solicitation, recommendation, endorsement, advertisement, or offer to buy or sell any securities, franchises, or other financial instruments, particularly in jurisdictions where such activity would be unlawful.
All content is of a general nature and may not address the specific circumstances of any individual or entity. It is not a substitute for professional advice or services. Any actions you take based on the information provided here are strictly at your own risk. You accept full responsibility for any decisions or outcomes arising from your use of this website and agree to release us from any liability in connection with your use of, or reliance upon, the content or products found herein.