
|
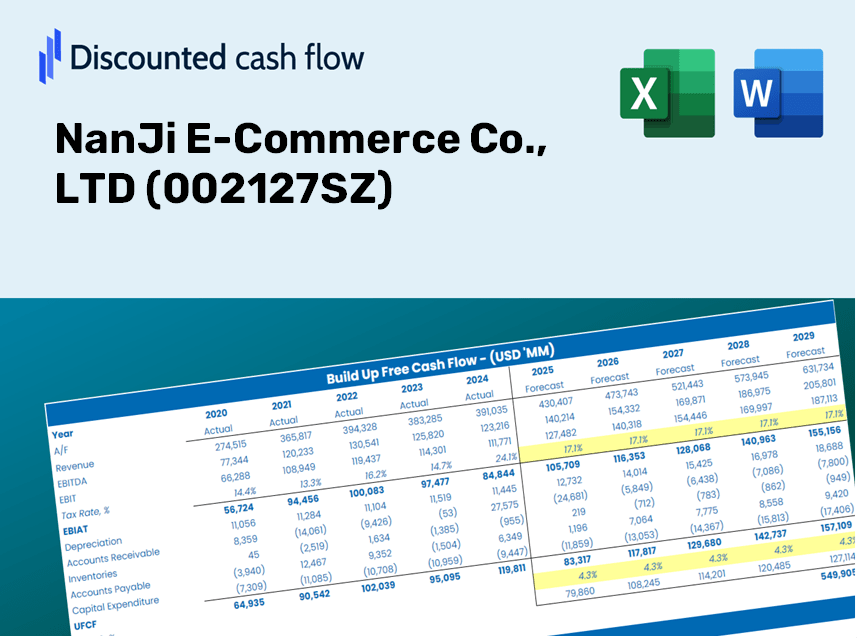
NanJi E-Commerce Co., LTD (002127.SZ) DCF Valuation |
Fully Editable: Tailor To Your Needs In Excel Or Sheets
Professional Design: Trusted, Industry-Standard Templates
Investor-Approved Valuation Models
MAC/PC Compatible, Fully Unlocked
No Expertise Is Needed; Easy To Follow
NanJi E-Commerce Co., LTD (002127.SZ) Bundle
Evaluate NanJi E-Commerce Co., LTD's financial prospects with expert precision! This (002127SZ) DCF Calculator provides pre-filled financial data and the flexibility to modify revenue growth, WACC, margins, and other essential assumptions to align with your predictions.
Discounted Cash Flow (DCF) - (USD MM)
| Year | AY1 2020 |
AY2 2021 |
AY3 2022 |
AY4 2023 |
AY5 2024 |
FY1 2025 |
FY2 2026 |
FY3 2027 |
FY4 2028 |
FY5 2029 |
|---|---|---|---|---|---|---|---|---|---|---|
| Revenue | 4,171.9 | 3,888.1 | 3,309.7 | 2,692.2 | 3,358.5 | 3,227.6 | 3,101.8 | 2,980.9 | 2,864.7 | 2,753.1 |
| Revenue Growth, % | 0 | -6.8 | -14.88 | -18.66 | 24.75 | -3.9 | -3.9 | -3.9 | -3.9 | -3.9 |
| EBITDA | 1,132.3 | 467.6 | 97.6 | 73.3 | -225.6 | 246.1 | 236.5 | 227.3 | 218.4 | 209.9 |
| EBITDA, % | 27.14 | 12.03 | 2.95 | 2.72 | -6.72 | 7.62 | 7.62 | 7.62 | 7.62 | 7.62 |
| Depreciation | 2.5 | 2.7 | 3.6 | 3.0 | 3.8 | 3.0 | 2.9 | 2.8 | 2.7 | 2.6 |
| Depreciation, % | 0.06024311 | 0.06896457 | 0.10949 | 0.11105 | 0.1139 | 0.09272762 | 0.09272762 | 0.09272762 | 0.09272762 | 0.09272762 |
| EBIT | 1,129.8 | 464.9 | 94.0 | 70.4 | -229.4 | 243.1 | 233.6 | 224.5 | 215.8 | 207.4 |
| EBIT, % | 27.08 | 11.96 | 2.84 | 2.61 | -6.83 | 7.53 | 7.53 | 7.53 | 7.53 | 7.53 |
| Total Cash | 3,473.5 | 2,423.1 | 2,478.6 | 3,003.9 | 2,697.4 | 2,587.1 | 2,486.3 | 2,389.4 | 2,296.3 | 2,206.8 |
| Total Cash, percent | .0 | .0 | .0 | .0 | .0 | .0 | .0 | .0 | .0 | .0 |
| Account Receivables | 1,182.7 | 1,043.8 | 627.0 | 472.8 | 411.1 | 671.0 | 644.8 | 619.7 | 595.5 | 572.3 |
| Account Receivables, % | 28.35 | 26.85 | 18.95 | 17.56 | 12.24 | 20.79 | 20.79 | 20.79 | 20.79 | 20.79 |
| Inventories | 3.0 | 3.7 | 98.1 | 33.6 | 114.6 | 50.3 | 48.3 | 46.4 | 44.6 | 42.9 |
| Inventories, % | 0.07207472 | 0.095016 | 2.96 | 1.25 | 3.41 | 1.56 | 1.56 | 1.56 | 1.56 | 1.56 |
| Accounts Payable | 150.2 | 94.0 | 77.4 | 49.3 | 257.7 | 115.3 | 110.8 | 106.5 | 102.3 | 98.4 |
| Accounts Payable, % | 3.6 | 2.42 | 2.34 | 1.83 | 7.67 | 3.57 | 3.57 | 3.57 | 3.57 | 3.57 |
| Capital Expenditure | -5.8 | -2.9 | -321.3 | -12.5 | -3.0 | -67.6 | -65.0 | -62.4 | -60.0 | -57.7 |
| Capital Expenditure, % | -0.13795 | -0.07444423 | -9.71 | -0.46259 | -0.08882848 | -2.09 | -2.09 | -2.09 | -2.09 | -2.09 |
| Tax Rate, % | 6.82 | 6.82 | 6.82 | 6.82 | 6.82 | 6.82 | 6.82 | 6.82 | 6.82 | 6.82 |
| EBITAT | 1,074.2 | 413.1 | 110.2 | 60.2 | -213.8 | 224.9 | 216.2 | 207.8 | 199.7 | 191.9 |
| Depreciation | ||||||||||
| Changes in Account Receivables | ||||||||||
| Changes in Inventories | ||||||||||
| Changes in Accounts Payable | ||||||||||
| Capital Expenditure | ||||||||||
| UFCF | 35.5 | 495.0 | 98.3 | 241.4 | -23.9 | -177.6 | 177.7 | 170.8 | 164.1 | 157.7 |
| WACC, % | 4.91 | 4.91 | 4.91 | 4.91 | 4.91 | 4.91 | 4.91 | 4.91 | 4.91 | 4.91 |
| PV UFCF | ||||||||||
| SUM PV UFCF | 399.8 | |||||||||
| Long Term Growth Rate, % | 4.00 | |||||||||
| Free cash flow (T + 1) | 164 | |||||||||
| Terminal Value | 18,059 | |||||||||
| Present Terminal Value | 14,212 | |||||||||
| Enterprise Value | 14,611 | |||||||||
| Net Debt | -2,069 | |||||||||
| Equity Value | 16,680 | |||||||||
| Diluted Shares Outstanding, MM | 2,356 | |||||||||
| Equity Value Per Share | 7.08 |
What You Will Receive
- Real NanJi Financials: Access to historical and projected data for precise valuation.
- Customizable Inputs: Adjust WACC, tax rates, revenue growth, and capital expenditures as needed.
- Automated Calculations: Intrinsic value and NPV are computed in real-time.
- Scenario Analysis: Explore various scenarios to assess the future performance of NanJi E-Commerce (002127SZ).
- User-Friendly Design: Designed for professionals while remaining approachable for novices.
Key Features
- Customizable Forecast Inputs: Adjust essential factors such as sales growth, profit margins, and investment expenditures.
- Instant DCF Valuation: Automatically computes intrinsic value, net present value (NPV), and other vital metrics.
- Industry-Leading Precision: Leverages real financial data from NanJi E-Commerce Co., LTD (002127SZ) for accurate valuation results.
- Effortless Scenario Analysis: Easily evaluate various assumptions and analyze different outcomes.
- Efficiency Booster: Streamlines the valuation process, removing the need for developing intricate models from scratch.
How It Works
- Step 1: Download the prebuilt Excel template containing data for NanJi E-Commerce Co., LTD (002127SZ).
- Step 2: Review the pre-filled sheets to familiarize yourself with the key performance metrics.
- Step 3: Adjust forecasts and underlying assumptions in the editable yellow cells (WACC, growth rates, profit margins).
- Step 4: Instantly see the updated results, including the intrinsic value of NanJi E-Commerce Co., LTD (002127SZ).
- Step 5: Use the outputs to make well-informed investment choices or create detailed reports.
Why Opt for the NanJi E-Commerce Calculator?
- All-In-One Solution: Features DCF, WACC, and an array of financial ratio analyses in a single tool.
- Flexible Inputs: Modify the yellow-highlighted fields to explore different financial scenarios.
- In-Depth Evaluations: Automatically assesses the intrinsic value and Net Present Value for NanJi E-Commerce Co., LTD (002127SZ).
- Pre-Loaded Information: Comes with historical and projected data to provide reliable benchmarks.
- Expert Level: Perfect for financial analysts, investors, and business consultants seeking precise insights.
Who Can Benefit from NanJi E-Commerce Co., LTD (002127SZ)?
- Investors: Gain insights and make informed decisions with an advanced valuation tool tailored for performance.
- Financial Analysts: Streamline your workflow with a customizable DCF model that enhances efficiency.
- Consultants: Effortlessly modify the template for impactful client presentations and detailed reports.
- Finance Enthusiasts: Expand your knowledge of valuation strategies through practical, real-world applications.
- Educators and Students: Utilize this resource as a hands-on learning aid in finance and investment courses.
What the Template Contains
- Operating and Balance Sheet Data: Pre-filled historical data and forecasts for NanJi E-Commerce Co., LTD (002127SZ), including revenue, EBITDA, EBIT, and capital expenditures.
- WACC Calculation: A dedicated sheet for Weighted Average Cost of Capital (WACC), featuring parameters such as Beta, risk-free rate, and share price.
- DCF Valuation (Unlevered and Levered): Customizable Discounted Cash Flow models that illustrate intrinsic value with in-depth calculations.
- Financial Statements: Pre-loaded annual and quarterly financial statements to facilitate comprehensive analysis.
- Key Ratios: A collection of profitability, leverage, and efficiency ratios specific to NanJi E-Commerce Co., LTD (002127SZ).
- Dashboard and Charts: Visual representations of valuation outputs and assumptions to simplify results analysis.
Disclaimer
All information, articles, and product details provided on this website are for general informational and educational purposes only. We do not claim any ownership over, nor do we intend to infringe upon, any trademarks, copyrights, logos, brand names, or other intellectual property mentioned or depicted on this site. Such intellectual property remains the property of its respective owners, and any references here are made solely for identification or informational purposes, without implying any affiliation, endorsement, or partnership.
We make no representations or warranties, express or implied, regarding the accuracy, completeness, or suitability of any content or products presented. Nothing on this website should be construed as legal, tax, investment, financial, medical, or other professional advice. In addition, no part of this site—including articles or product references—constitutes a solicitation, recommendation, endorsement, advertisement, or offer to buy or sell any securities, franchises, or other financial instruments, particularly in jurisdictions where such activity would be unlawful.
All content is of a general nature and may not address the specific circumstances of any individual or entity. It is not a substitute for professional advice or services. Any actions you take based on the information provided here are strictly at your own risk. You accept full responsibility for any decisions or outcomes arising from your use of this website and agree to release us from any liability in connection with your use of, or reliance upon, the content or products found herein.