
|
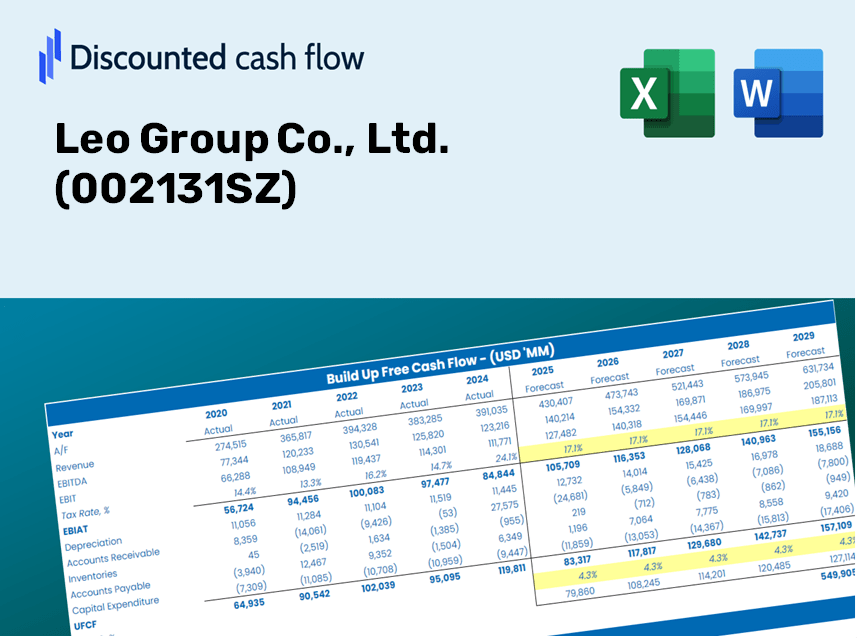
Leo Group Co., Ltd. (002131.SZ) DCF Valuation |
Fully Editable: Tailor To Your Needs In Excel Or Sheets
Professional Design: Trusted, Industry-Standard Templates
Investor-Approved Valuation Models
MAC/PC Compatible, Fully Unlocked
No Expertise Is Needed; Easy To Follow
Leo Group Co., Ltd. (002131.SZ) Bundle
Whether you're an investor or analyst, this (002131SZ) DCF Calculator is your essential tool for accurate valuation. Preloaded with Leo Group Co., Ltd. real data, you can adjust forecasts and observe the effects in real-time.
Discounted Cash Flow (DCF) - (USD MM)
| Year | AY1 2020 |
AY2 2021 |
AY3 2022 |
AY4 2023 |
AY5 2024 |
FY1 2025 |
FY2 2026 |
FY3 2027 |
FY4 2028 |
FY5 2029 |
|---|---|---|---|---|---|---|---|---|---|---|
| Revenue | 15,547.9 | 20,280.9 | 20,268.3 | 20,471.4 | 21,170.5 | 23,012.2 | 25,014.0 | 27,190.0 | 29,555.3 | 32,126.4 |
| Revenue Growth, % | 0 | 30.44 | -0.06197677 | 1 | 3.41 | 8.7 | 8.7 | 8.7 | 8.7 | 8.7 |
| EBITDA | 567.2 | 357.4 | 399.2 | 197.5 | 349.9 | 460.2 | 500.2 | 543.7 | 591.0 | 642.4 |
| EBITDA, % | 3.65 | 1.76 | 1.97 | 0.96457 | 1.65 | 2 | 2 | 2 | 2 | 2 |
| Depreciation | 132.6 | 140.0 | 140.9 | 183.4 | 187.8 | 185.1 | 201.2 | 218.7 | 237.7 | 258.4 |
| Depreciation, % | 0.8526 | 0.69028 | 0.69511 | 0.8959 | 0.8871 | 0.8042 | 0.8042 | 0.8042 | 0.8042 | 0.8042 |
| EBIT | 434.7 | 217.4 | 258.4 | 14.1 | 162.1 | 275.1 | 299.0 | 325.0 | 353.3 | 384.0 |
| EBIT, % | 2.8 | 1.07 | 1.27 | 0.06867387 | 0.76583 | 1.2 | 1.2 | 1.2 | 1.2 | 1.2 |
| Total Cash | 987.5 | 1,726.3 | 3,046.3 | 6,990.8 | 6,419.0 | 4,343.0 | 4,720.8 | 5,131.5 | 5,577.9 | 6,063.1 |
| Total Cash, percent | .0 | .0 | .0 | .0 | .0 | .0 | .0 | .0 | .0 | .0 |
| Account Receivables | 5,497.4 | 5,494.7 | 5,984.5 | 6,720.1 | 6,139.4 | 7,078.7 | 7,694.5 | 8,363.8 | 9,091.4 | 9,882.3 |
| Account Receivables, % | 35.36 | 27.09 | 29.53 | 32.83 | 29 | 30.76 | 30.76 | 30.76 | 30.76 | 30.76 |
| Inventories | 474.2 | 790.6 | 649.0 | 842.1 | 862.4 | 844.0 | 917.4 | 997.2 | 1,083.9 | 1,178.2 |
| Inventories, % | 3.05 | 3.9 | 3.2 | 4.11 | 4.07 | 3.67 | 3.67 | 3.67 | 3.67 | 3.67 |
| Accounts Payable | 3,131.0 | 2,753.9 | 3,029.8 | 3,693.3 | 3,078.9 | 3,739.5 | 4,064.8 | 4,418.4 | 4,802.7 | 5,220.5 |
| Accounts Payable, % | 20.14 | 13.58 | 14.95 | 18.04 | 14.54 | 16.25 | 16.25 | 16.25 | 16.25 | 16.25 |
| Capital Expenditure | -289.2 | -177.9 | -389.5 | -312.5 | -285.2 | -346.7 | -376.8 | -409.6 | -445.3 | -484.0 |
| Capital Expenditure, % | -1.86 | -0.87707 | -1.92 | -1.53 | -1.35 | -1.51 | -1.51 | -1.51 | -1.51 | -1.51 |
| Tax Rate, % | 37.1 | 37.1 | 37.1 | 37.1 | 37.1 | 37.1 | 37.1 | 37.1 | 37.1 | 37.1 |
| EBITAT | 328.0 | 262.8 | 184.4 | 10.6 | 102.0 | 212.1 | 230.5 | 250.6 | 272.4 | 296.1 |
| Depreciation | ||||||||||
| Changes in Account Receivables | ||||||||||
| Changes in Inventories | ||||||||||
| Changes in Accounts Payable | ||||||||||
| Capital Expenditure | ||||||||||
| UFCF | -2,669.2 | -465.8 | -136.5 | -383.6 | -49.4 | -209.9 | -309.0 | -335.9 | -365.1 | -396.9 |
| WACC, % | 4.5 | 4.58 | 4.48 | 4.5 | 4.45 | 4.5 | 4.5 | 4.5 | 4.5 | 4.5 |
| PV UFCF | ||||||||||
| SUM PV UFCF | -1,402.7 | |||||||||
| Long Term Growth Rate, % | 2.00 | |||||||||
| Free cash flow (T + 1) | -405 | |||||||||
| Terminal Value | -16,172 | |||||||||
| Present Terminal Value | -12,975 | |||||||||
| Enterprise Value | -14,377 | |||||||||
| Net Debt | 539 | |||||||||
| Equity Value | -14,916 | |||||||||
| Diluted Shares Outstanding, MM | 6,482 | |||||||||
| Equity Value Per Share | -2.30 |
What You Will Receive
- Authentic 002131SZ Financial Data: Pre-loaded with Leo Group's historical and forecasted data for accurate analysis.
- Completely Customizable Template: Easily adjust key inputs such as revenue growth, WACC, and EBITDA percentage.
- Instant Calculations: Watch the intrinsic value of Leo Group update in real-time as you make changes.
- Professional Valuation Tool: Tailored for investors, analysts, and consultants who require precise DCF results.
- Intuitive Design: User-friendly layout and straightforward instructions cater to all skill levels.
Key Features
- 🔍 Real-Life Leo Group Financials: Pre-filled historical and projected data for Leo Group Co., Ltd. (002131SZ).
- ✏️ Fully Customizable Inputs: Modify all essential parameters (yellow cells) such as WACC, growth %, and tax rates.
- 📊 Professional DCF Valuation: Integrated formulas assess Leo Group’s intrinsic value using the Discounted Cash Flow method.
- ⚡ Instant Results: Visualize Leo Group’s valuation immediately after making adjustments.
- Scenario Analysis: Evaluate and compare various financial assumptions side-by-side.
How It Works
- Step 1: Download the Excel file.
- Step 2: Review the pre-filled data for Leo Group Co., Ltd. (002131SZ) including historical and forecasted figures.
- Step 3: Modify the key assumptions (highlighted in yellow) according to your analysis.
- Step 4: Observe the automatic updates for the intrinsic value of Leo Group Co., Ltd. (002131SZ).
- Step 5: Utilize the results to inform your investment strategies or reporting.
Why Choose the Leo Group Co., Ltd. (002131SZ) Calculator?
- All-in-One Solution: Features DCF, WACC, and financial ratio analyses integrated into a single tool.
- Flexible Inputs: Modify the yellow-highlighted cells to explore different scenarios.
- In-Depth Analysis: Automatically determines the intrinsic value and Net Present Value for Leo Group Co., Ltd. (002131SZ).
- Data Ready: Comes with historical and projected data for reliable starting points.
- High-Quality Standards: Perfect for financial analysts, investors, and business consultants seeking accurate insights.
Who Can Benefit from This Product?
- Professional Investors: Develop comprehensive and dependable valuation models for analyzing portfolios involving Leo Group Co., Ltd. (002131SZ).
- Corporate Finance Teams: Evaluate valuation scenarios to inform internal decision-making strategies.
- Consultants and Advisors: Deliver precise valuation insights for clients considering investments in Leo Group Co., Ltd. (002131SZ).
- Students and Educators: Utilize real-world data to enhance learning and practice in financial modeling.
- Tech Enthusiasts: Gain insights into how companies like Leo Group Co., Ltd. (002131SZ) are valued in the marketplace.
Contents of the Template
- Pre-Filled Data: Features Leo Group Co., Ltd.'s historical financials and projections.
- Discounted Cash Flow Model: An editable DCF valuation model with automated calculations.
- Weighted Average Cost of Capital (WACC): A dedicated sheet designed for calculating WACC using custom inputs.
- Key Financial Ratios: Evaluate Leo Group Co., Ltd.'s [002131SZ] profitability, efficiency, and leverage.
- Customizable Inputs: Easily modify revenue growth, margins, and tax rates.
- Clear Dashboard: Visual representations and tables that summarize essential valuation results.
Disclaimer
All information, articles, and product details provided on this website are for general informational and educational purposes only. We do not claim any ownership over, nor do we intend to infringe upon, any trademarks, copyrights, logos, brand names, or other intellectual property mentioned or depicted on this site. Such intellectual property remains the property of its respective owners, and any references here are made solely for identification or informational purposes, without implying any affiliation, endorsement, or partnership.
We make no representations or warranties, express or implied, regarding the accuracy, completeness, or suitability of any content or products presented. Nothing on this website should be construed as legal, tax, investment, financial, medical, or other professional advice. In addition, no part of this site—including articles or product references—constitutes a solicitation, recommendation, endorsement, advertisement, or offer to buy or sell any securities, franchises, or other financial instruments, particularly in jurisdictions where such activity would be unlawful.
All content is of a general nature and may not address the specific circumstances of any individual or entity. It is not a substitute for professional advice or services. Any actions you take based on the information provided here are strictly at your own risk. You accept full responsibility for any decisions or outcomes arising from your use of this website and agree to release us from any liability in connection with your use of, or reliance upon, the content or products found herein.