
|
Shenzhen Sunlord Electronics Co.,Ltd. (002138.SZ) DCF Valuation |
Fully Editable: Tailor To Your Needs In Excel Or Sheets
Professional Design: Trusted, Industry-Standard Templates
Investor-Approved Valuation Models
MAC/PC Compatible, Fully Unlocked
No Expertise Is Needed; Easy To Follow
Shenzhen Sunlord Electronics Co.,Ltd. (002138.SZ) Bundle
Discover the true value of Shenzhen Sunlord Electronics Co., Ltd. with our professional-grade DCF Calculator! Customize key assumptions, explore various scenarios, and evaluate how adjustments affect the valuation of Shenzhen Sunlord Electronics Co., Ltd. – all within a convenient Excel template.
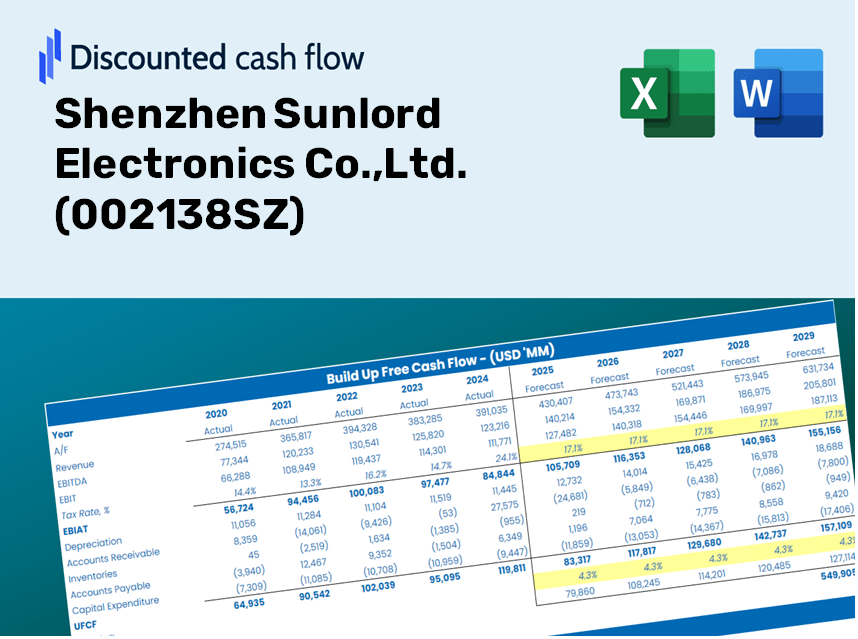
Discounted Cash Flow (DCF) - (USD MM)
| Year | AY1 2020 |
AY2 2021 |
AY3 2022 |
AY4 2023 |
AY5 2024 |
FY1 2025 |
FY2 2026 |
FY3 2027 |
FY4 2028 |
FY5 2029 |
|---|---|---|---|---|---|---|---|---|---|---|
| Revenue | 3,476.6 | 4,577.3 | 4,238.2 | 5,040.4 | 5,896.9 | 6,784.0 | 7,804.5 | 8,978.6 | 10,329.2 | 11,883.0 |
| Revenue Growth, % | 0 | 31.66 | -7.41 | 18.93 | 16.99 | 15.04 | 15.04 | 15.04 | 15.04 | 15.04 |
| EBITDA | 1,073.1 | 1,417.9 | 1,151.8 | 1,491.0 | 1,759.0 | 2,013.9 | 2,316.8 | 2,665.3 | 3,066.3 | 3,527.5 |
| EBITDA, % | 30.87 | 30.98 | 27.18 | 29.58 | 29.83 | 29.69 | 29.69 | 29.69 | 29.69 | 29.69 |
| Depreciation | 356.0 | 420.7 | 502.8 | 558.2 | 578.0 | 707.9 | 814.4 | 936.9 | 1,077.8 | 1,239.9 |
| Depreciation, % | 10.24 | 9.19 | 11.86 | 11.07 | 9.8 | 10.43 | 10.43 | 10.43 | 10.43 | 10.43 |
| EBIT | 717.0 | 997.1 | 649.0 | 932.8 | 1,180.9 | 1,306.0 | 1,502.4 | 1,728.5 | 1,988.5 | 2,287.6 |
| EBIT, % | 20.62 | 21.78 | 15.31 | 18.51 | 20.03 | 19.25 | 19.25 | 19.25 | 19.25 | 19.25 |
| Total Cash | 325.7 | 493.3 | 458.4 | 778.8 | 302.3 | 699.3 | 804.5 | 925.5 | 1,064.7 | 1,224.9 |
| Total Cash, percent | .0 | .0 | .0 | .0 | .0 | .0 | .0 | .0 | .0 | .0 |
| Account Receivables | 1,592.7 | 1,985.6 | 2,109.2 | 2,706.2 | 3,067.1 | 3,319.5 | 3,818.9 | 4,393.4 | 5,054.3 | 5,814.6 |
| Account Receivables, % | 45.81 | 43.38 | 49.77 | 53.69 | 52.01 | 48.93 | 48.93 | 48.93 | 48.93 | 48.93 |
| Inventories | 621.2 | 1,048.0 | 929.6 | 864.6 | 997.0 | 1,312.8 | 1,510.3 | 1,737.5 | 1,998.8 | 2,299.5 |
| Inventories, % | 17.87 | 22.9 | 21.93 | 17.15 | 16.91 | 19.35 | 19.35 | 19.35 | 19.35 | 19.35 |
| Accounts Payable | 672.7 | 889.0 | 613.1 | 803.5 | 900.2 | 1,145.7 | 1,318.1 | 1,516.4 | 1,744.5 | 2,006.9 |
| Accounts Payable, % | 19.35 | 19.42 | 14.47 | 15.94 | 15.27 | 16.89 | 16.89 | 16.89 | 16.89 | 16.89 |
| Capital Expenditure | -1,159.7 | -1,372.5 | -1,367.7 | -1,100.8 | -818.9 | -1,782.0 | -2,050.1 | -2,358.5 | -2,713.3 | -3,121.5 |
| Capital Expenditure, % | -33.36 | -29.98 | -32.27 | -21.84 | -13.89 | -26.27 | -26.27 | -26.27 | -26.27 | -26.27 |
| Tax Rate, % | 23.19 | 23.19 | 23.19 | 23.19 | 23.19 | 23.19 | 23.19 | 23.19 | 23.19 | 23.19 |
| EBITAT | 614.6 | 833.0 | 486.6 | 711.5 | 907.1 | 1,037.8 | 1,193.9 | 1,373.5 | 1,580.2 | 1,817.9 |
| Depreciation | ||||||||||
| Changes in Account Receivables | ||||||||||
| Changes in Inventories | ||||||||||
| Changes in Accounts Payable | ||||||||||
| Capital Expenditure | ||||||||||
| UFCF | -1,730.2 | -722.2 | -659.5 | -172.7 | 269.7 | -359.0 | -566.3 | -651.5 | -749.5 | -862.3 |
| WACC, % | 7.12 | 7.11 | 7.09 | 7.09 | 7.09 | 7.1 | 7.1 | 7.1 | 7.1 | 7.1 |
| PV UFCF | ||||||||||
| SUM PV UFCF | -2,540.8 | |||||||||
| Long Term Growth Rate, % | 4.00 | |||||||||
| Free cash flow (T + 1) | -897 | |||||||||
| Terminal Value | -28,918 | |||||||||
| Present Terminal Value | -20,521 | |||||||||
| Enterprise Value | -23,062 | |||||||||
| Net Debt | 2,384 | |||||||||
| Equity Value | -25,446 | |||||||||
| Diluted Shares Outstanding, MM | 792 | |||||||||
| Equity Value Per Share | -32.11 |
What You Will Receive
- Comprehensive Financial Model: Utilize Shenzhen Sunlord Electronics Co., Ltd.'s actual data for accurate DCF valuation.
- Complete Forecast Control: Modify revenue growth, profit margins, WACC, and other essential variables.
- Real-Time Calculations: Automatic updates provide immediate results as you adjust inputs.
- Professional-Grade Template: A polished Excel file specifically crafted for high-quality valuation.
- Flexible and Reusable: Designed for adaptability, allowing for repeated use in detailed forecasting.
Key Features
- Pre-Loaded Data: Shenzhen Sunlord Electronics’ historical financial statements and pre-filled forecasts.
- Fully Adjustable Inputs: Customize WACC, tax rates, revenue growth, and EBITDA margins.
- Instant Results: Watch Shenzhen Sunlord Electronics' intrinsic value update in real time.
- Clear Visual Outputs: Dashboard charts showcase valuation results and essential metrics.
- Built for Accuracy: A professional tool designed for analysts, investors, and finance professionals.
How It Functions
- 1. Access the Template: Download and open the Excel file featuring Shenzhen Sunlord Electronics Co., Ltd.'s (002138SZ) preloaded data.
- 2. Modify Assumptions: Adjust essential inputs such as growth rates, WACC, and capital expenditures.
- 3. Instant Result Display: The DCF model automatically calculates intrinsic value and NPV in real-time.
- 4. Explore Scenarios: Analyze various forecasts to evaluate different valuation outcomes.
- 5. Present with Assurance: Deliver professional valuation insights to enhance your decision-making process.
Why Choose Shenzhen Sunlord Electronics Co., Ltd. (002138SZ)?
- Time Efficiency: Skip the hassle of building models from scratch – our solutions are instantly accessible.
- Enhanced Accuracy: Dependable financial data and formulas minimize valuation errors.
- Completely Customizable: Modify the model to align with your specific assumptions and forecasts.
- User-Friendly Design: Intuitive charts and outputs facilitate straightforward analysis of results.
- Preferred by Professionals: Crafted for experts who prioritize both precision and ease of use.
Who Can Benefit from This Product?
- Professional Investors: Create comprehensive and precise valuation models for portfolio evaluation focused on Shenzhen Sunlord Electronics Co., Ltd. (002138SZ).
- Corporate Finance Teams: Assess valuation scenarios to inform strategic decisions within the organization.
- Consultants and Advisors: Deliver clients well-informed valuation insights regarding Shenzhen Sunlord Electronics Co., Ltd. (002138SZ).
- Students and Educators: Utilize real-time data to practice and enhance financial modeling skills.
- Tech Enthusiasts: Gain insights into the valuation methods applied to technology companies like Shenzhen Sunlord Electronics Co., Ltd. (002138SZ).
What the Template Includes
- Pre-Filled Data: Contains Shenzhen Sunlord Electronics' historical financial performance and projections.
- Discounted Cash Flow Model: An editable DCF valuation model featuring automatic calculations.
- Weighted Average Cost of Capital (WACC): A dedicated worksheet for WACC calculation based on tailored inputs.
- Key Financial Ratios: Evaluate Shenzhen Sunlord's profitability, efficiency, and financial leverage.
- Customizable Inputs: Easily modify revenue growth, profit margins, and tax rates.
- Clear Dashboard: Visual representations and tables summarizing essential valuation outcomes.
Disclaimer
All information, articles, and product details provided on this website are for general informational and educational purposes only. We do not claim any ownership over, nor do we intend to infringe upon, any trademarks, copyrights, logos, brand names, or other intellectual property mentioned or depicted on this site. Such intellectual property remains the property of its respective owners, and any references here are made solely for identification or informational purposes, without implying any affiliation, endorsement, or partnership.
We make no representations or warranties, express or implied, regarding the accuracy, completeness, or suitability of any content or products presented. Nothing on this website should be construed as legal, tax, investment, financial, medical, or other professional advice. In addition, no part of this site—including articles or product references—constitutes a solicitation, recommendation, endorsement, advertisement, or offer to buy or sell any securities, franchises, or other financial instruments, particularly in jurisdictions where such activity would be unlawful.
All content is of a general nature and may not address the specific circumstances of any individual or entity. It is not a substitute for professional advice or services. Any actions you take based on the information provided here are strictly at your own risk. You accept full responsibility for any decisions or outcomes arising from your use of this website and agree to release us from any liability in connection with your use of, or reliance upon, the content or products found herein.