
|
Hengkang Medical Group Co., Ltd. (002219.SZ) DCF Valuation |
Fully Editable: Tailor To Your Needs In Excel Or Sheets
Professional Design: Trusted, Industry-Standard Templates
Investor-Approved Valuation Models
MAC/PC Compatible, Fully Unlocked
No Expertise Is Needed; Easy To Follow
Hengkang Medical Group Co., Ltd. (002219.SZ) Bundle
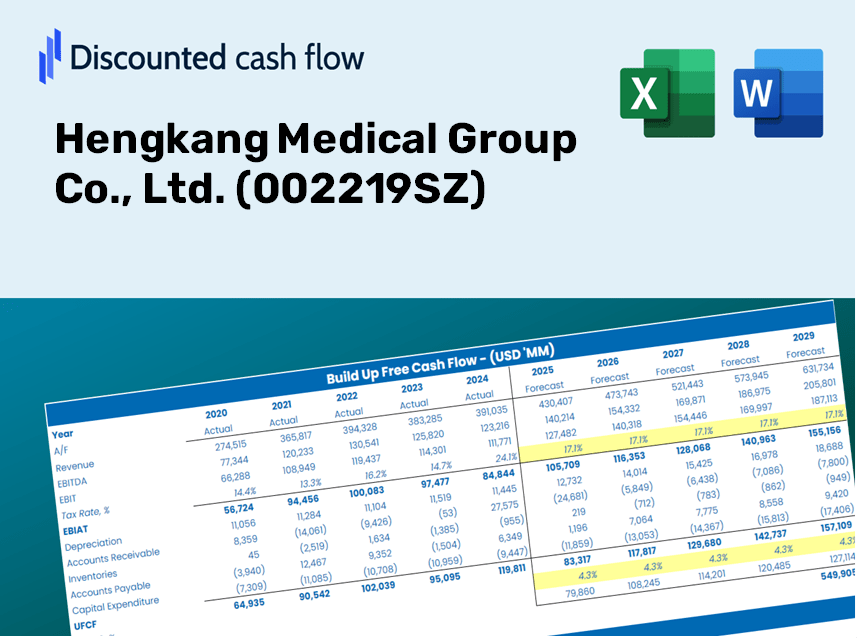
Gain insight into your Hengkang Medical Group Co., Ltd. (002219SZ) valuation analysis with our sophisticated DCF Calculator! Preloaded with real (002219SZ) data, this Excel template enables you to adjust forecasts and assumptions to accurately determine the intrinsic value of Hengkang Medical Group Co., Ltd.
Discounted Cash Flow (DCF) - (USD MM)
| Year | AY1 2020 |
AY2 2021 |
AY3 2022 |
AY4 2023 |
AY5 2024 |
FY1 2025 |
FY2 2026 |
FY3 2027 |
FY4 2028 |
FY5 2029 |
|---|---|---|---|---|---|---|---|---|---|---|
| Revenue | 2,805.9 | 3,016.1 | 3,161.0 | 3,914.3 | 3,799.0 | 4,114.2 | 4,455.4 | 4,825.0 | 5,225.3 | 5,658.7 |
| Revenue Growth, % | 0 | 7.49 | 4.8 | 23.83 | -2.95 | 8.3 | 8.3 | 8.3 | 8.3 | 8.3 |
| EBITDA | 349.9 | 127.3 | 385.9 | 384.7 | 466.9 | 419.8 | 454.6 | 492.3 | 533.2 | 577.4 |
| EBITDA, % | 12.47 | 4.22 | 12.21 | 9.83 | 12.29 | 10.2 | 10.2 | 10.2 | 10.2 | 10.2 |
| Depreciation | 170.7 | 162.8 | 155.9 | 207.8 | 159.7 | 213.3 | 231.0 | 250.2 | 271.0 | 293.4 |
| Depreciation, % | 6.08 | 5.4 | 4.93 | 5.31 | 4.2 | 5.19 | 5.19 | 5.19 | 5.19 | 5.19 |
| EBIT | 179.3 | -35.6 | 229.9 | 176.9 | 307.2 | 206.4 | 223.6 | 242.1 | 262.2 | 283.9 |
| EBIT, % | 6.39 | -1.18 | 7.27 | 4.52 | 8.09 | 5.02 | 5.02 | 5.02 | 5.02 | 5.02 |
| Total Cash | 171.7 | 2,033.2 | 558.9 | 580.2 | 478.1 | 976.0 | 1,057.0 | 1,144.7 | 1,239.6 | 1,342.5 |
| Total Cash, percent | .0 | .0 | .0 | .0 | .0 | .0 | .0 | .0 | .0 | .0 |
| Account Receivables | 782.8 | 710.3 | 909.6 | 1,121.5 | 1,313.0 | 1,180.2 | 1,278.1 | 1,384.2 | 1,499.0 | 1,623.3 |
| Account Receivables, % | 27.9 | 23.55 | 28.78 | 28.65 | 34.56 | 28.69 | 28.69 | 28.69 | 28.69 | 28.69 |
| Inventories | 178.3 | 185.3 | 164.4 | 218.5 | 202.4 | 235.4 | 254.9 | 276.1 | 299.0 | 323.8 |
| Inventories, % | 6.35 | 6.14 | 5.2 | 5.58 | 5.33 | 5.72 | 5.72 | 5.72 | 5.72 | 5.72 |
| Accounts Payable | 874.8 | 1,000.4 | 1,162.9 | 1,318.8 | 1,544.2 | 1,443.9 | 1,563.7 | 1,693.4 | 1,833.8 | 1,986.0 |
| Accounts Payable, % | 31.18 | 33.17 | 36.79 | 33.69 | 40.65 | 35.1 | 35.1 | 35.1 | 35.1 | 35.1 |
| Capital Expenditure | -216.6 | -198.7 | -221.6 | -195.2 | -307.4 | -283.0 | -306.5 | -331.9 | -359.5 | -389.3 |
| Capital Expenditure, % | -7.72 | -6.59 | -7.01 | -4.99 | -8.09 | -6.88 | -6.88 | -6.88 | -6.88 | -6.88 |
| Tax Rate, % | 25.59 | 25.59 | 25.59 | 25.59 | 25.59 | 25.59 | 25.59 | 25.59 | 25.59 | 25.59 |
| EBITAT | -937.4 | -36.4 | 191.3 | 462.0 | 228.6 | 147.7 | 159.9 | 173.2 | 187.5 | 203.1 |
| Depreciation | ||||||||||
| Changes in Account Receivables | ||||||||||
| Changes in Inventories | ||||||||||
| Changes in Accounts Payable | ||||||||||
| Capital Expenditure | ||||||||||
| UFCF | -1,069.6 | 118.8 | 109.8 | 364.5 | 131.0 | 77.3 | 86.8 | 94.0 | 101.8 | 110.2 |
| WACC, % | 4.79 | 6.36 | 6.09 | 6.36 | 5.96 | 5.91 | 5.91 | 5.91 | 5.91 | 5.91 |
| PV UFCF | ||||||||||
| SUM PV UFCF | 393.1 | |||||||||
| Long Term Growth Rate, % | 3.50 | |||||||||
| Free cash flow (T + 1) | 114 | |||||||||
| Terminal Value | 4,732 | |||||||||
| Present Terminal Value | 3,551 | |||||||||
| Enterprise Value | 3,944 | |||||||||
| Net Debt | 940 | |||||||||
| Equity Value | 3,004 | |||||||||
| Diluted Shares Outstanding, MM | 3,288 | |||||||||
| Equity Value Per Share | 0.91 |
What You Will Receive
- Customizable Excel Template: A versatile Excel-based DCF Calculator featuring pre-filled financial data for Hengkang Medical Group Co., Ltd. (002219SZ).
- Comprehensive Data: Access to historical information and forward-looking projections (highlighted in the yellow cells).
- Adaptable Forecasts: Modify key assumptions such as revenue growth, EBITDA percentage, and WACC to suit your analysis.
- Instant Calculations: Observe real-time changes in Hengkang’s valuation based on your inputs.
- Professional Resource: Designed for investors, CFOs, consultants, and financial analysts looking to enhance their toolkit.
- User-Friendly Layout: Organized for straightforward navigation, complete with clear step-by-step guidance.
Key Features
- Pre-Loaded Data: Hengkang Medical Group Co., Ltd.'s historical financial statements and pre-filled projections.
- Fully Adjustable Inputs: Customize WACC, tax rates, revenue growth, and EBITDA margins as needed.
- Instant Results: View the intrinsic value of Hengkang Medical Group Co., Ltd. recalculated in real time.
- Clear Visual Outputs: Dashboard charts showcase valuation results and essential metrics.
- Built for Accuracy: A professional-grade tool designed for analysts, investors, and finance professionals.
How It Works
- Step 1: Download the prebuilt Excel template containing data for Hengkang Medical Group Co., Ltd. (002219SZ).
- Step 2: Review the pre-filled worksheets to familiarize yourself with the essential metrics.
- Step 3: Modify the forecasts and assumptions in the editable yellow cells (WACC, growth, margins) as needed.
- Step 4: Instantly see recalibrated results, including the intrinsic value of Hengkang Medical Group Co., Ltd. (002219SZ).
- Step 5: Utilize the outcomes to make informed investment decisions or create detailed reports.
Why Choose This Calculator for Hengkang Medical Group Co., Ltd. (002219SZ)?
- Designed for Professionals: A sophisticated tool tailored for analysts, CFOs, and industry consultants.
- Comprehensive Data: Hengkang Medical's historical and forecasted financial data preloaded for optimal accuracy.
- Flexible Scenario Analysis: Effortlessly test various forecasts and assumptions.
- Insightful Outputs: Automatically computes intrinsic value, NPV, and essential financial metrics.
- User-Friendly: Clear, step-by-step instructions to navigate the tool with ease.
Who Can Benefit from This Product?
- Investors: Evaluate Hengkang Medical Group’s valuation before making stock transactions.
- CFOs and Financial Analysts: Optimize valuation workflows and assess financial forecasts.
- Startup Founders: Discover the valuation strategies of established companies like Hengkang Medical Group.
- Consultants: Provide detailed valuation reports to assist clients with their financial decisions.
- Students and Educators: Utilize actual market data for practicing and teaching valuation methodologies.
Contents of the Template
- Pre-Filled Data: Features Hengkang Medical Group Co., Ltd.'s historical financial performance and projections.
- Discounted Cash Flow Model: An editable DCF valuation model with automated calculations.
- Weighted Average Cost of Capital (WACC): A dedicated worksheet for WACC calculations based on user-defined inputs.
- Key Financial Ratios: Evaluate Hengkang Medical's profitability, efficiency, and financial leverage.
- Customizable Inputs: Easily modify revenue growth rates, profit margins, and tax rates.
- User-Friendly Dashboard: Visualizations and tables that highlight essential valuation outcomes.
Disclaimer
All information, articles, and product details provided on this website are for general informational and educational purposes only. We do not claim any ownership over, nor do we intend to infringe upon, any trademarks, copyrights, logos, brand names, or other intellectual property mentioned or depicted on this site. Such intellectual property remains the property of its respective owners, and any references here are made solely for identification or informational purposes, without implying any affiliation, endorsement, or partnership.
We make no representations or warranties, express or implied, regarding the accuracy, completeness, or suitability of any content or products presented. Nothing on this website should be construed as legal, tax, investment, financial, medical, or other professional advice. In addition, no part of this site—including articles or product references—constitutes a solicitation, recommendation, endorsement, advertisement, or offer to buy or sell any securities, franchises, or other financial instruments, particularly in jurisdictions where such activity would be unlawful.
All content is of a general nature and may not address the specific circumstances of any individual or entity. It is not a substitute for professional advice or services. Any actions you take based on the information provided here are strictly at your own risk. You accept full responsibility for any decisions or outcomes arising from your use of this website and agree to release us from any liability in connection with your use of, or reliance upon, the content or products found herein.