
|
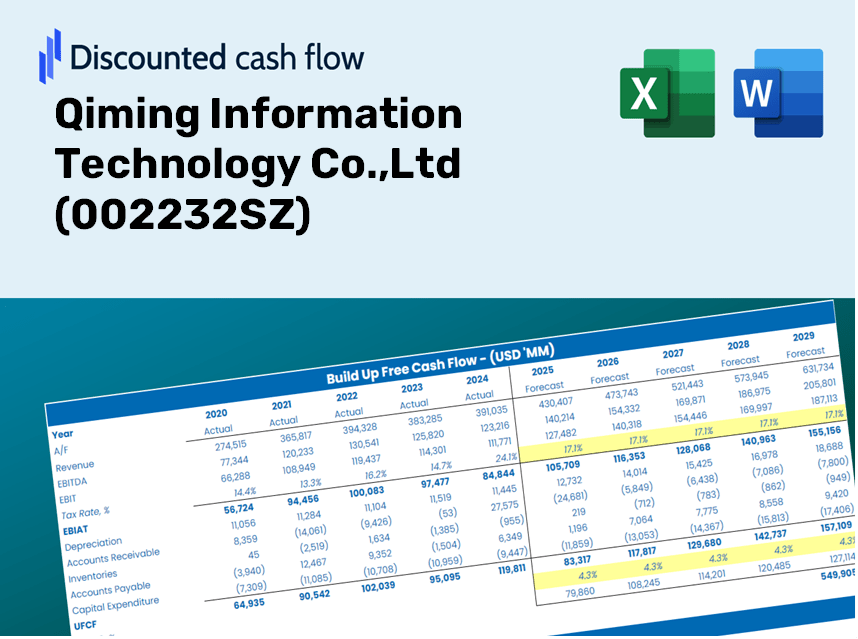
Qiming Information Technology Co.,Ltd (002232.SZ) DCF Valuation |
Fully Editable: Tailor To Your Needs In Excel Or Sheets
Professional Design: Trusted, Industry-Standard Templates
Investor-Approved Valuation Models
MAC/PC Compatible, Fully Unlocked
No Expertise Is Needed; Easy To Follow
Qiming Information Technology Co.,Ltd (002232.SZ) Bundle
Enhance your investment strategies with the (002232SZ) DCF Calculator! Explore Qiming Information Technology Co., Ltd's actual financials, adjust growth projections and expenses, and instantly observe how these modifications affect the intrinsic value of the company.
Discounted Cash Flow (DCF) - (USD MM)
| Year | AY1 2020 |
AY2 2021 |
AY3 2022 |
AY4 2023 |
AY5 2024 |
FY1 2025 |
FY2 2026 |
FY3 2027 |
FY4 2028 |
FY5 2029 |
|---|---|---|---|---|---|---|---|---|---|---|
| Revenue | 1,551.9 | 1,051.2 | 1,541.1 | 1,243.2 | 878.3 | 803.0 | 734.0 | 671.0 | 613.4 | 560.8 |
| Revenue Growth, % | 0 | -32.26 | 46.61 | -19.33 | -29.35 | -8.58 | -8.58 | -8.58 | -8.58 | -8.58 |
| EBITDA | 218.9 | 67.9 | 76.7 | 44.2 | 10.4 | 48.6 | 44.5 | 40.6 | 37.2 | 34.0 |
| EBITDA, % | 14.1 | 6.46 | 4.98 | 3.56 | 1.19 | 6.06 | 6.06 | 6.06 | 6.06 | 6.06 |
| Depreciation | 56.9 | 49.6 | 41.9 | 36.4 | 30.3 | 28.1 | 25.7 | 23.5 | 21.4 | 19.6 |
| Depreciation, % | 3.67 | 4.72 | 2.72 | 2.92 | 3.46 | 3.5 | 3.5 | 3.5 | 3.5 | 3.5 |
| EBIT | 162.0 | 18.3 | 34.9 | 7.9 | -19.9 | 20.6 | 18.8 | 17.2 | 15.7 | 14.4 |
| EBIT, % | 10.44 | 1.74 | 2.26 | 0.63379 | -2.27 | 2.56 | 2.56 | 2.56 | 2.56 | 2.56 |
| Total Cash | 1,018.8 | 652.9 | 524.5 | 865.3 | 789.4 | 515.9 | 471.6 | 431.2 | 394.1 | 360.3 |
| Total Cash, percent | .0 | .0 | .0 | .0 | .0 | .0 | .0 | .0 | .0 | .0 |
| Account Receivables | 502.6 | 448.8 | 855.6 | 666.1 | 700.5 | 423.9 | 387.5 | 354.2 | 323.8 | 296.0 |
| Account Receivables, % | 32.39 | 42.69 | 55.52 | 53.58 | 79.76 | 52.79 | 52.79 | 52.79 | 52.79 | 52.79 |
| Inventories | 353.3 | 523.8 | 240.2 | 168.4 | 70.4 | 176.2 | 161.1 | 147.3 | 134.6 | 123.1 |
| Inventories, % | 22.76 | 49.83 | 15.59 | 13.55 | 8.01 | 21.95 | 21.95 | 21.95 | 21.95 | 21.95 |
| Accounts Payable | 453.1 | 455.7 | 544.4 | 509.7 | 318.6 | 297.3 | 271.8 | 248.5 | 227.1 | 207.6 |
| Accounts Payable, % | 29.2 | 43.35 | 35.32 | 41 | 36.27 | 37.03 | 37.03 | 37.03 | 37.03 | 37.03 |
| Capital Expenditure | -9.9 | -5.5 | -61.3 | -80.7 | -49.8 | -27.8 | -25.4 | -23.2 | -21.2 | -19.4 |
| Capital Expenditure, % | -0.64072 | -0.52335 | -3.97 | -6.49 | -5.67 | -3.46 | -3.46 | -3.46 | -3.46 | -3.46 |
| Tax Rate, % | 6.9 | 6.9 | 6.9 | 6.9 | 6.9 | 6.9 | 6.9 | 6.9 | 6.9 | 6.9 |
| EBITAT | 141.8 | 15.8 | 32.2 | 5.9 | -18.5 | 17.9 | 16.3 | 14.9 | 13.6 | 12.5 |
| Depreciation | ||||||||||
| Changes in Account Receivables | ||||||||||
| Changes in Inventories | ||||||||||
| Changes in Accounts Payable | ||||||||||
| Capital Expenditure | ||||||||||
| UFCF | -214.1 | -54.2 | -21.8 | 188.1 | -165.5 | 167.7 | 42.6 | 38.9 | 35.6 | 32.5 |
| WACC, % | 6.03 | 6.03 | 6.03 | 6.03 | 6.03 | 6.03 | 6.03 | 6.03 | 6.03 | 6.03 |
| PV UFCF | ||||||||||
| SUM PV UFCF | 281.1 | |||||||||
| Long Term Growth Rate, % | 4.00 | |||||||||
| Free cash flow (T + 1) | 34 | |||||||||
| Terminal Value | 1,666 | |||||||||
| Present Terminal Value | 1,243 | |||||||||
| Enterprise Value | 1,524 | |||||||||
| Net Debt | -789 | |||||||||
| Equity Value | 2,313 | |||||||||
| Diluted Shares Outstanding, MM | 409 | |||||||||
| Equity Value Per Share | 5.66 |
What You Will Receive
- Customizable Excel Template: A fully editable Excel-based DCF Calculator featuring pre-filled financial data for Qiming Information Technology Co., Ltd (002232SZ).
- Comprehensive Data: Access to historical data and forward-looking projections (highlighted in the yellow cells).
- Assumption Flexibility: Easily modify forecast parameters such as revenue growth, EBITDA %, and WACC.
- Instant Calculations: Quickly observe how your inputs influence the valuation of Qiming Information Technology Co., Ltd (002232SZ).
- Professional Resource: Designed specifically for investors, CFOs, consultants, and financial analysts.
- Intuitive Layout: Organized for simplicity and ease of navigation, complete with step-by-step guidance.
Key Features
- Actual Qiming Data: Pre-loaded with Qiming Information Technology Co., Ltd's historical financial performance and future forecasts.
- Completely Adjustable Inputs: Tailor revenue growth, profit margins, WACC, tax rates, and capital expenditure settings.
- Adaptive Valuation Model: Automatically refreshes Net Present Value (NPV) and intrinsic value based on your input adjustments.
- Scenario Analysis: Build various forecasting scenarios to evaluate different valuation possibilities.
- Intuitive Interface: Easy to navigate, well-structured, catering to both professionals and those new to the field.
How It Functions
- 1. Access the Template: Download and open the Excel file containing preloaded data for Qiming Information Technology Co.,Ltd (002232SZ).
- 2. Modify Assumptions: Adjust essential inputs such as growth rates, WACC, and capital expenditures as needed.
- 3. See Immediate Results: The DCF model automatically calculates the intrinsic value and NPV in real-time.
- 4. Evaluate Scenarios: Analyze various forecasts to assess different valuation results.
- 5. Present with Assurance: Share professional valuation insights to strengthen your decision-making process.
Why Select This Calculator for Qiming Information Technology Co., Ltd (002232SZ)?
- Reliable Data: Up-to-date financial information for Qiming ensures trustworthy valuation outcomes.
- Customizable Features: Modify key factors such as growth rates, WACC, and tax rates to fit your forecasts.
- Efficient: Pre-configured calculations save you the time of building from the ground up.
- High-Quality Tool: Tailored for investors, analysts, and consultants involved with Qiming.
- User-Friendly Interface: An intuitive design and guided instructions facilitate ease of use for everyone.
Who Can Benefit from This Product?
- Investors: Accurately assess the fair value of Qiming Information Technology Co., Ltd (002232SZ) prior to making investment choices.
- CFOs: Utilize a high-quality DCF model for comprehensive financial reporting and analysis.
- Consultants: Seamlessly customize the template for client valuation reports.
- Entrepreneurs: Acquire valuable insights into the financial modeling practices of leading companies.
- Educators: Employ this tool to illustrate various valuation methodologies effectively.
Contents of the Template
- Pre-Filled DCF Model: Qiming Information Technology's financial data preloaded for immediate utilization.
- WACC Calculator: Comprehensive calculations for the Weighted Average Cost of Capital.
- Financial Ratios: Assess Qiming's profitability, leverage, and operational efficiency.
- Editable Inputs: Modify assumptions such as growth rates, margins, and CAPEX to suit your scenarios.
- Financial Statements: Access annual and quarterly reports for in-depth analysis.
- Interactive Dashboard: Effortlessly visualize essential valuation metrics and outcomes.
Disclaimer
All information, articles, and product details provided on this website are for general informational and educational purposes only. We do not claim any ownership over, nor do we intend to infringe upon, any trademarks, copyrights, logos, brand names, or other intellectual property mentioned or depicted on this site. Such intellectual property remains the property of its respective owners, and any references here are made solely for identification or informational purposes, without implying any affiliation, endorsement, or partnership.
We make no representations or warranties, express or implied, regarding the accuracy, completeness, or suitability of any content or products presented. Nothing on this website should be construed as legal, tax, investment, financial, medical, or other professional advice. In addition, no part of this site—including articles or product references—constitutes a solicitation, recommendation, endorsement, advertisement, or offer to buy or sell any securities, franchises, or other financial instruments, particularly in jurisdictions where such activity would be unlawful.
All content is of a general nature and may not address the specific circumstances of any individual or entity. It is not a substitute for professional advice or services. Any actions you take based on the information provided here are strictly at your own risk. You accept full responsibility for any decisions or outcomes arising from your use of this website and agree to release us from any liability in connection with your use of, or reliance upon, the content or products found herein.