
|
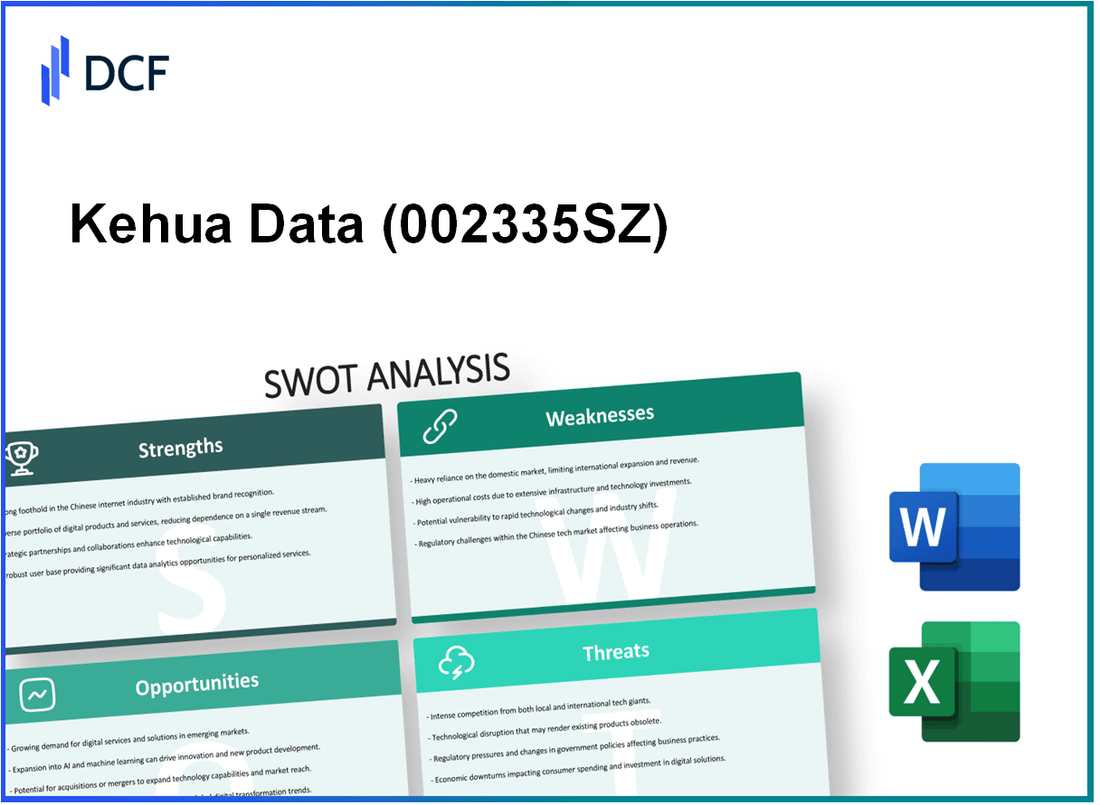
Kehua Data Co., Ltd. (002335.SZ): SWOT Analysis |
Fully Editable: Tailor To Your Needs In Excel Or Sheets
Professional Design: Trusted, Industry-Standard Templates
Investor-Approved Valuation Models
MAC/PC Compatible, Fully Unlocked
No Expertise Is Needed; Easy To Follow
Kehua Data Co., Ltd. (002335.SZ) Bundle
In today's fast-evolving energy and technology landscape, understanding a company's positioning is crucial for strategic success. Kehua Data Co., Ltd. offers a compelling case study through its SWOT analysis, showcasing its strengths, weaknesses, opportunities, and threats. Dive deeper to uncover how this innovative player navigates challenges and capitalizes on emerging trends in the competitive market.
Kehua Data Co., Ltd. - SWOT Analysis: Strengths
Kehua Data Co., Ltd. has established a strong brand reputation in the energy and technology sectors. The company is recognized for its commitment to quality and reliability, especially in power supply and energy management solutions. In the 2022 Brand Value Report, Kehua was ranked among the top 10 brands in the Chinese UPS market, highlighting its competitive edge.
The Diverse product portfolio is another significant strength. Kehua offers a wide range of products, including uninterruptible power supplies (UPS), energy storage systems, and solar inverters. As of 2023, the company reported that its products serve over 100,000 clients across various industries, including telecommunications, banking, and healthcare.
Robust R&D capabilities are a cornerstone of Kehua's strategy to drive continuous innovation. The company invests approximately 7% of its annual revenue into research and development. In 2022, this amounted to around CNY 200 million (approximately $30 million), which enabled the launch of several cutting-edge technologies, such as their latest UPS models featuring advanced energy management systems.
Furthermore, Kehua boasts an established international presence with a growing global market share. As of 2023, the company's products are sold in over 50 countries, with a reported international revenue increase of 25% year-over-year. This expansion is reflected in its international sales, which accounted for around CNY 1 billion (approximately $150 million) in 2022.
| Key Strengths | Details |
|---|---|
| Brand Reputation | Ranked top 10 in the Chinese UPS market (2022 Brand Value Report) |
| Diverse Product Portfolio | Over 100,000 clients in various industries |
| R&D Investment | 7% of annual revenue, CNY 200 million ($30 million in 2022) |
| International Presence | Sold in 50+ countries, CNY 1 billion ($150 million) in international sales (2022) |
Kehua Data Co., Ltd. - SWOT Analysis: Weaknesses
Dependence on certain geographic markets limiting diversification: Kehua Data has a strong reliance on the Chinese market, which represented approximately 65% of its total revenue in 2022. This significant dependence limits its ability to capture growth in other regions and increases vulnerability to local economic fluctuations. Recent expansions into Southeast Asia have yielded only 10% of total sales, illustrating limited market penetration.
High production costs affecting overall profit margins: In its latest financial report, Kehua Data indicated that production costs accounted for about 78% of its total expenses. This high cost structure has led to a gross margin of only 22%, which is below the industry average of 30%. Factors contributing to high production costs include expensive raw materials and energy costs, coupled with a lack of economies of scale in manufacturing.
| Year | Gross Margin (%) | Production Costs (% of Revenue) | Industry Average Gross Margin (%) |
|---|---|---|---|
| 2021 | 23 | 77 | 31 |
| 2022 | 22 | 78 | 30 |
| 2023 | (Projected) 21 | (Projected) 80 | 30 |
Potential gaps in software and data analytics expertise: Kehua Data's IT division reported a 30% employee turnover rate among key software developers in 2022, leading to challenges in maintaining expertise in rapidly evolving data analytics technologies. The company also allocated less than 5% of its revenue towards R&D in software development, significantly below the 15% average for competitors within the industry.
Limited strategic partnerships in emerging markets: Despite efforts to enter new markets, Kehua has formed only three strategic alliances in the past three years, impacting its ability to leverage local expertise and distribution channels. In contrast, key competitors have established a minimum of seven partnerships in similar emerging markets, providing them with a competitive advantage and enhanced market access.
Kehua Data Co., Ltd. - SWOT Analysis: Opportunities
The global demand for renewable energy solutions is projected to reach $2 trillion by 2025, growing at a compound annual growth rate (CAGR) of approximately 8.4% from 2020 to 2025. This presents a significant opportunity for Kehua Data Co., Ltd. to expand its offerings in solar inverters and energy storage systems, given the company's strong foothold in the renewable energy sector.
In addition to renewable energy, Kehua Data can capitalize on its expansion into underpenetrated markets. For instance, Southeast Asia's energy sector investment is expected to surge, with projected investments reaching $100 billion by 2025, particularly in countries like Vietnam and the Philippines where electricity demand is rapidly increasing.
Moreover, the Internet of Things (IoT) and smart grid technologies are experiencing explosive growth. The global IoT market is anticipated to exceed $1.1 trillion by 2026, with smart grid technologies representing a significant portion of this growth. The smart grid market alone is expected to grow from $40 billion in 2021 to around $100 billion by 2026 at a CAGR of 19.5%. This trend serves as a prime opportunity for Kehua Data to innovate and integrate its power solutions into smart infrastructure.
Furthermore, potential strategic alliances can enhance Kehua Data's technological offerings. The trend of partnerships in the energy sector is on the rise, with companies increasingly seeking collaborations to leverage technology. For example, a notable strategic alliance was formed between Siemens and AES to create a joint venture focusing on energy storage solutions, valued at approximately $1 billion. Such alliances could enhance Kehua Data's market presence and technological capabilities.
| Opportunity Area | Current Market Size | Projected Market Size (2025) | Growth Rate (CAGR) |
|---|---|---|---|
| Renewable Energy Solutions | $1 trillion (2020) | $2 trillion | 8.4% |
| Southeast Asia Energy Sector | N/A | $100 billion | N/A |
| IoT Market | $400 billion (2021) | $1.1 trillion | 20.6% |
| Smart Grid Technologies | $40 billion (2021) | $100 billion | 19.5% |
| Strategic Alliances (example) | $1 billion (Siemens & AES) | N/A | N/A |
Kehua Data Co., Ltd. - SWOT Analysis: Threats
The competitive landscape for Kehua Data Co., Ltd. is characterized by intense competition from both established global and local players. Key competitors include companies such as Schneider Electric, Huawei Technologies Co., Ltd., and Eaton Corporation. In 2022, Schneider Electric reported revenues of approximately $34.4 billion, while Huawei's revenue was around $100.5 billion. The growth of these competitors poses a constant challenge for Kehua, impacting market share and pricing strategies.
Regulatory changes in the energy sector further complicate the operational environment. The International Energy Agency (IEA) highlighted that the global transition to renewable energy by 2030 requires significant regulatory support. Changes in government policies, such as carbon pricing and incentives for renewables, can drastically alter market dynamics. In 2022, the U.S. Inflation Reduction Act allocated $369 billion for energy programs, influencing market direction and competition.
The volatility of raw material prices is another significant threat. In 2023, copper prices fluctuated between $3.50 to $4.50 per pound. Given that copper is essential for electrical components, these fluctuations can severely affect Kehua's cost structures. The price of lithium carbonate, another critical material for energy storage solutions, reached approximately $70,000 per ton, marking an increase of over 400% since early 2021.
Lastly, rapid technological advancements necessitate continuous adaptation. The global energy storage market is projected to grow at a compound annual growth rate (CAGR) of 28.3% from 2022 to 2030. Companies that fail to keep pace with innovations risk losing competitive advantage. For instance, advancements in battery technology and grid management solutions are moving swiftly, compelling companies like Kehua to innovate constantly or face obsolescence.
| Threat Factor | Description | Impact Level | Recent Statistics |
|---|---|---|---|
| Competition | Established players like Schneider and Huawei increasing market share. | High | Schneider Electric: $34.4B (2022) |
| Regulatory Changes | Changing energy policies impacting operational strategies. | Medium | U.S. Inflation Reduction Act: $369B allocated (2022) |
| Raw Material Prices | Price volatility affecting production costs. | High | Copper: $3.50 - $4.50 per lb (2023); Lithium: $70K per ton |
| Technological Advancements | Need for continuous innovation to keep pace with the market. | Medium | Energy storage CAGR: 28.3% (2022-2030) |
Kehua Data Co., Ltd. stands at a pivotal crossroads in the energy and technology sectors, with its solid strengths and burgeoning opportunities poised to propel its growth; however, it must navigate its identified weaknesses and external threats to fully harness its potential and maintain a competitive edge in this dynamic landscape.
Disclaimer
All information, articles, and product details provided on this website are for general informational and educational purposes only. We do not claim any ownership over, nor do we intend to infringe upon, any trademarks, copyrights, logos, brand names, or other intellectual property mentioned or depicted on this site. Such intellectual property remains the property of its respective owners, and any references here are made solely for identification or informational purposes, without implying any affiliation, endorsement, or partnership.
We make no representations or warranties, express or implied, regarding the accuracy, completeness, or suitability of any content or products presented. Nothing on this website should be construed as legal, tax, investment, financial, medical, or other professional advice. In addition, no part of this site—including articles or product references—constitutes a solicitation, recommendation, endorsement, advertisement, or offer to buy or sell any securities, franchises, or other financial instruments, particularly in jurisdictions where such activity would be unlawful.
All content is of a general nature and may not address the specific circumstances of any individual or entity. It is not a substitute for professional advice or services. Any actions you take based on the information provided here are strictly at your own risk. You accept full responsibility for any decisions or outcomes arising from your use of this website and agree to release us from any liability in connection with your use of, or reliance upon, the content or products found herein.