
|
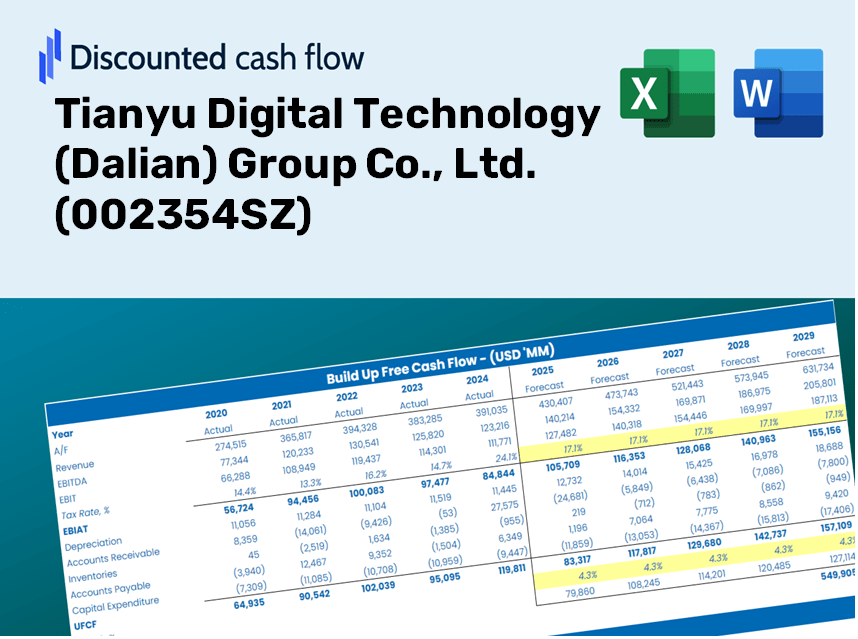
Tianyu Digital Technology Group Co., Ltd. (002354.SZ) DCF Valuation |
Fully Editable: Tailor To Your Needs In Excel Or Sheets
Professional Design: Trusted, Industry-Standard Templates
Investor-Approved Valuation Models
MAC/PC Compatible, Fully Unlocked
No Expertise Is Needed; Easy To Follow
Tianyu Digital Technology (Dalian) Group Co., Ltd. (002354.SZ) Bundle
Looking to calculate the intrinsic value of Tianyu Digital Technology (Dalian) Group Co., Ltd.? Our (002354SZ) DCF Calculator incorporates real-world data with extensive customization features, allowing you to refine your forecasts and enhance your investment strategies.
What You Will Receive
- Customizable Forecast Inputs: Effortlessly adjust key assumptions (growth %, profit margins, WACC) to explore various scenarios.
- Comprehensive Data: Pre-filled financial information for Tianyu Digital Technology (Dalian) Group Co., Ltd. (002354SZ) to facilitate your analysis.
- Automated DCF Calculation: The template generates Net Present Value (NPV) and intrinsic value automatically.
- Professional and Flexible: A sleek Excel model tailored to meet your valuation requirements.
- Designed for Analysts and Investors: Perfect for assessing projections, verifying strategies, and enhancing efficiency.
Key Features
- Comprehensive DCF Calculator: Offers detailed unlevered and levered DCF valuation models tailored for Tianyu Digital Technology (Dalian) Group Co., Ltd. (002354SZ).
- WACC Calculator: Features a pre-built Weighted Average Cost of Capital sheet with adjustable inputs specific to the company's financials.
- Customizable Forecast Assumptions: Easily modify growth projections, capital expenditures, and discount rates to fit your analysis needs.
- Integrated Financial Ratios: Evaluate profitability, leverage, and efficiency ratios relevant to Tianyu Digital Technology (Dalian) Group Co., Ltd. (002354SZ).
- Interactive Dashboard and Charts: Visual representations provide a quick overview of essential valuation metrics for straightforward assessment.
How It Works
- 1. Access the Template: Download and open the Excel file containing Tianyu Digital Technology's preloaded data.
- 2. Modify Assumptions: Adjust crucial inputs such as growth rates, WACC, and capital expenditures.
- 3. Instantaneous Results: The DCF model automatically calculates intrinsic value and NPV in real-time.
- 4. Evaluate Scenarios: Analyze various forecasts to explore different valuation outcomes.
- 5. Present with Assurance: Deliver professional valuation insights to inform your strategic decisions.
Why Opt for This Calculator?
- Precision: Utilizes authentic Tianyu Digital Technology (Dalian) Group Co., Ltd. (002354SZ) financial data for reliable results.
- Versatility: Built for users to easily test and adjust inputs as needed.
- Efficiency: Bypass the complexities of creating a DCF model from the ground up.
- High-Quality Standards: Crafted with the expertise and precision expected at the CFO level.
- Intuitive Design: Simple to navigate, even for those without extensive financial modeling expertise.
Who Can Benefit from This Product?
- Professional Investors: Create comprehensive and accurate valuation models for portfolio assessments of Tianyu Digital Technology (Dalian) Group Co., Ltd. (002354SZ).
- Corporate Finance Teams: Evaluate valuation scenarios to inform strategic decisions within the organization.
- Consultants and Advisors: Deliver precise valuation insights to clients regarding Tianyu Digital Technology (Dalian) Group Co., Ltd. (002354SZ).
- Students and Educators: Utilize real-world data to practice and teach financial modeling concepts.
- Tech Enthusiasts: Gain an understanding of how technology companies like Tianyu Digital Technology (Dalian) Group Co., Ltd. (002354SZ) are assessed in the marketplace.
Contents of the Template
- Operating and Balance Sheet Data: Pre-filled historical data and forecasts for Tianyu Digital Technology (Dalian) Group Co., Ltd. (002354SZ), covering metrics such as revenue, EBITDA, EBIT, and capital expenditures.
- WACC Calculation: A specific sheet for calculating the Weighted Average Cost of Capital (WACC), featuring parameters like Beta, the risk-free rate, and share price.
- DCF Valuation (Unlevered and Levered): Customizable Discounted Cash Flow models that illustrate intrinsic value with comprehensive calculations.
- Financial Statements: Pre-loaded annual and quarterly financial statements to facilitate in-depth analysis.
- Key Ratios: A collection of critical profitability, leverage, and efficiency ratios relevant to Tianyu Digital Technology (Dalian) Group Co., Ltd. (002354SZ).
- Dashboard and Charts: A visual summary of valuation results and underlying assumptions for straightforward analysis.
Disclaimer
All information, articles, and product details provided on this website are for general informational and educational purposes only. We do not claim any ownership over, nor do we intend to infringe upon, any trademarks, copyrights, logos, brand names, or other intellectual property mentioned or depicted on this site. Such intellectual property remains the property of its respective owners, and any references here are made solely for identification or informational purposes, without implying any affiliation, endorsement, or partnership.
We make no representations or warranties, express or implied, regarding the accuracy, completeness, or suitability of any content or products presented. Nothing on this website should be construed as legal, tax, investment, financial, medical, or other professional advice. In addition, no part of this site—including articles or product references—constitutes a solicitation, recommendation, endorsement, advertisement, or offer to buy or sell any securities, franchises, or other financial instruments, particularly in jurisdictions where such activity would be unlawful.
All content is of a general nature and may not address the specific circumstances of any individual or entity. It is not a substitute for professional advice or services. Any actions you take based on the information provided here are strictly at your own risk. You accept full responsibility for any decisions or outcomes arising from your use of this website and agree to release us from any liability in connection with your use of, or reliance upon, the content or products found herein.